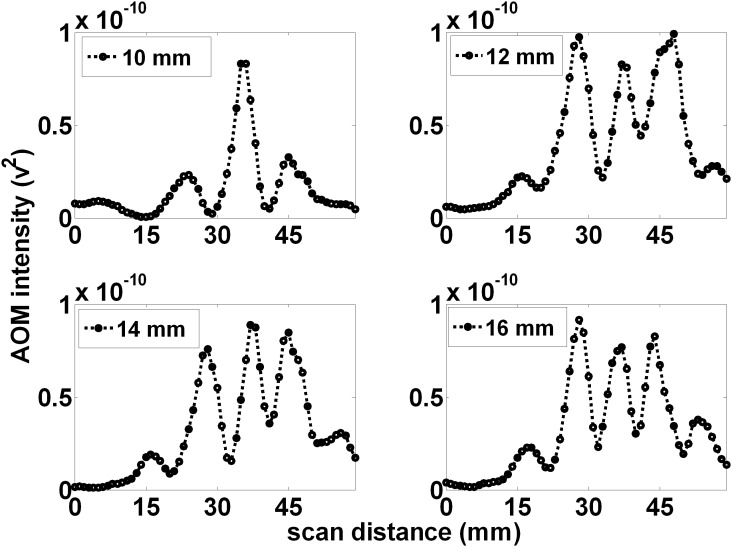
Figure 6. The spatial pattern scales with increased projection magnification.
When the projection distance = 140 mm and LED to ultrasound focal zone distance = 10 mm (A), the distant pattern displays alternating peaks with an average peak to peak distance of 10.5 mm. This can be used to calculate an expected 0.75 mm average width of the alternating regions within the ultrasound focal zone. This suggests the pattern scales with expected projection magnification. Similar to figure 5, as the LED was positioned further from the ultrasound focal zone, (B), (C), and (D), the observed pattern narrowed with additional peaks being added on the fringes of the pattern. In addition, the individual peaks narrow.

