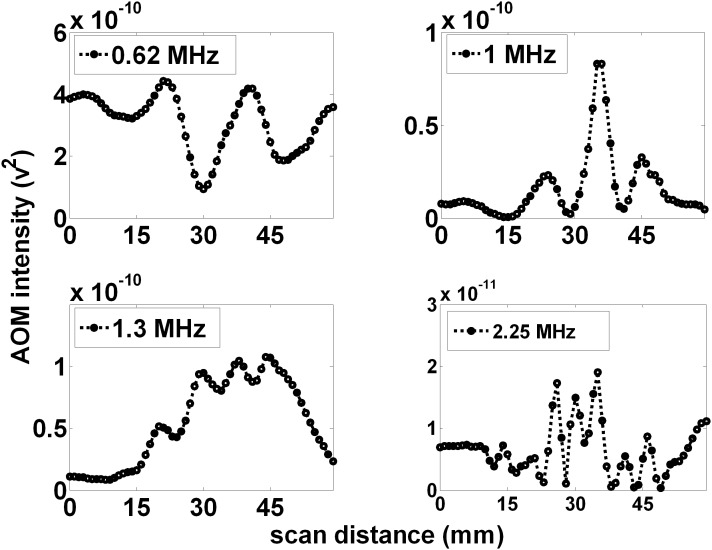
Figure 7. Increasing the applied ultrasound frequency increases the number of projected AOM peaks.
The number of observed peaks and their separation within the observed pattern appears to scale with ultrasound frequency, (A), (B), (C), and (D), with 2, 3, 4, and 7 peaks observed for ultrasound frequencies of 0.62, 1.0, 1.3, and 2.25 MHz, respectively.

