Figure 3.

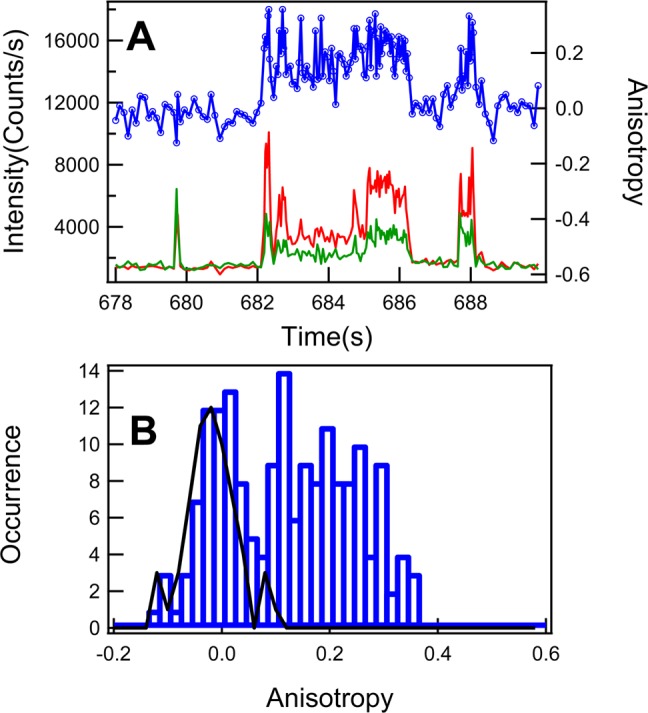
Single-molecule fluorescence anisotropy fluctuation and distribution of single HRP-catalyzed oxidation of Amplex Red fluorogenic assay. (A) Single-molecule fluorescence anisotropy fluctuation. Intensity trajectory from the perpendicular polarization component relative to the polarization of excitation (green) and the simultaneously recorded intensity trajectory from the parallel polarization component relative to the polarization of excitation (red); the calculated anisotropy trajectory (blue) using eq 2 from the pair of polarization components (red and green). (B) Anisotropy distribution from the trajectory (blue) in A. The anisotropy distribution from the background (black) with mean of −0.020 and standard deviation of 0.054. It is evident that the signal anisotropy distribution (blue) is identifiable, beyond the background distribution.
