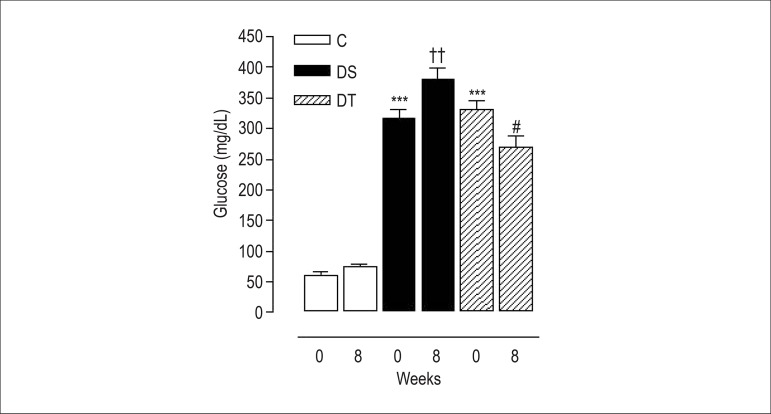
Figure 1.
Variation of blood glucose levels of rats at the beginning (0) and by the end (8) of eight weeks of training: control group (C); diabetic sedentary group (DS); and diabetic trained group (DT). Data are expressed as mean ± standard error of the mean. The statistical differences were determined by repeated measures analysis of variance followed by Bonferroni post-test. *** p < 0.001 vs. C 0; †† p < 0.01 vs. DS 0; and # p < 0.05 vs. DT 0.

