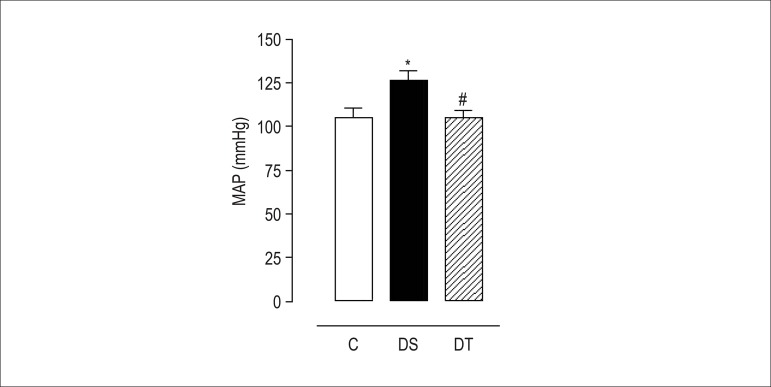
Figure 4.
Mean arterial blood pressure of rats of the groups control (C), diabetic sedentary (DS), and diabetic trained (DT) after eight weeks of resistance exercise. Data are expressed as mean ± standard error of the mean. The statistical differences were determined by repeated measures analysis of variance followed by Bonferroni post-test. * p < 0.05 DS vs. C and # p < 0.05 DT vs. DS.

