
Figure 12. Plot of eigenvalues corresponding to eigenvector index for the first fifty modes of motion of p53C.
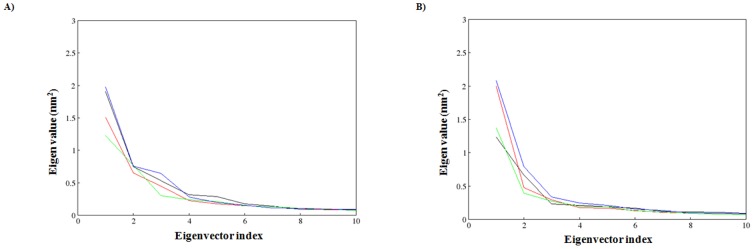
A) represents the apo simulation B) represents the holo simulation. Black: WT, red: R110P, green: P151T and blue: P278A.
Official websites use .gov
A
.gov website belongs to an official
government organization in the United States.
Secure .gov websites use HTTPS
A lock (
) or https:// means you've safely
connected to the .gov website. Share sensitive
information only on official, secure websites.
A) represents the apo simulation B) represents the holo simulation. Black: WT, red: R110P, green: P151T and blue: P278A.