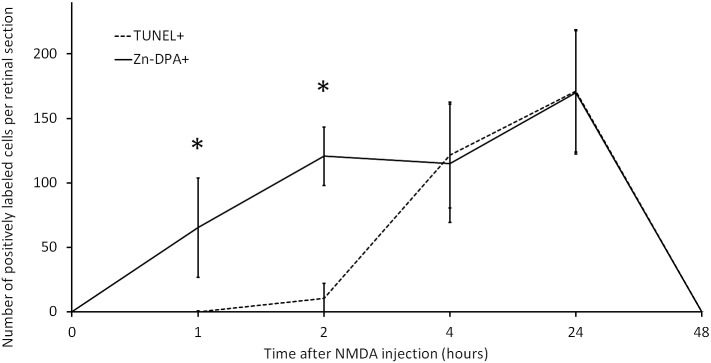
Figure 5.

Quantitative analysis of TUNEL and Zn-DPA 480. The numbers of Zn-DPA 480– and TUNEL-positive cells were counted on retinal sections at times after NMDA injection. The number of Zn-DPA 480–positive cells was increased from 1 hour and peaked at 24 hours but declined to zero at 48 hours. Only a few TUNEL-positive cells were observed at 2 hours and more TUNEL-positive cells were noted at 4 and 24 hours but no TUNEL-positive cells were found at 48 hours. At 1 and 2 hours after NMDA injection, the numbers of Zn-DPA 480–positive cells were significantly higher than the numbers of TUNEL. *P < 0.05; n = 4 per time point. Error bars represent SD.
