Figure 5.
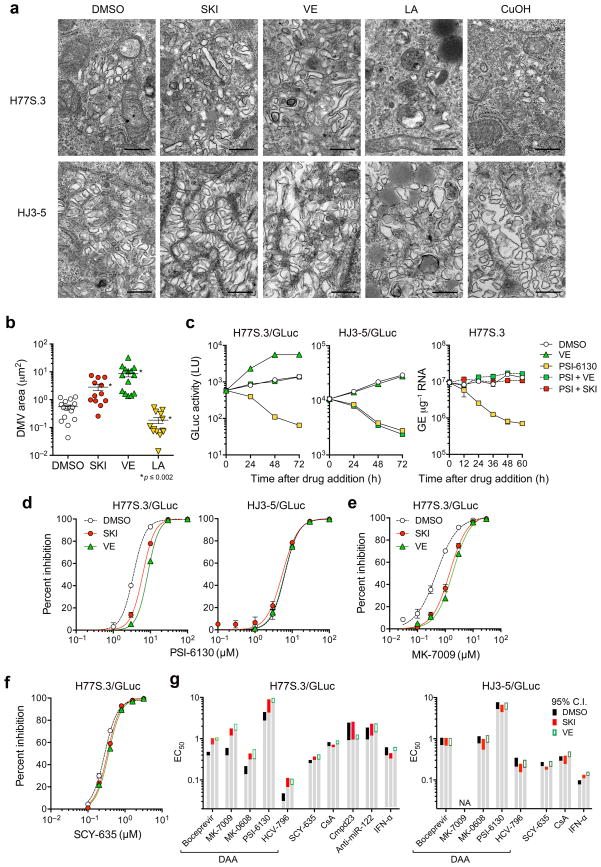
Lipid peroxidation reduces HCV-induced membranous web abundance and alters the EC50 of DAAs. (a) Transmission electron microscopic images of the membranous web in Huh-7.5 cells electroporated with H77S.3 or HJ3-5 RNA and treated with DMSO, SKI (1 μM), VE (1 μM), LA (50 μM), or CuOH (10 μM). Scale bar = 500 nm. (b) Quantitation of area occupied by double-membrane vesicles (DMV) within individual cells infected with H77S.3 virus and treated with SKI, VE, or LA as in a. *P ≤ 0.002 vs. DMSO by two-sided Mann-Whitney test. (c) SKI and VE mask the antiviral effect of PSI-6130 against H77S.3/GLuc replication. (left) Huh-7.5 cells electroporated with H77S.3/GLuc or HJ3-5/GLuc RNA were cultured for 7 d, then treated with DMSO, 10 μM PSI-6130, 1 μM VE or both PSI-6130 and VE. Culture supernatant fluids were replaced every 24 h and assayed for GLuc activity. (right) Huh-7.5 cells were electroporated with H77S.3 RNA, cultured for 5 d and then treated with DMSO, PSI-6130, SKI or VE, or PSI-6130 plus SKI or VE. Cell-associated HCV RNA was quantified by qRT-PCR. Results represent mean ± s.e.m from two (left) or three (right) replicate cultures. (d) Inhibition of H77S.3 (left) and HJ3-5 (right) replication by the NS5B inhibitor PSI-6130 in the presence of SKI or VE (each 1 μM) or DMSO vehicle. Inhibition was assessed by quantifying GLuc secreted 48–72 h after drug addition. Results represent mean ± s.e.m. of two replicate cultures. (e,f) Inhibition of H77S.3 replication by (e) MK-7009, an NS3/4A inhibitor, and (f) SCY-635, a host-targeting cyclophilin inhibitor. (g) EC50 values of representative direct- versus indirect-acting antivirals against H77S.3 (left) and HJ3-5 (right) viruses in the presence of SKI or VE (each 1 μM). Assays were carried out as in panels d–f. Colored bars represent limits of the 95% c.i. of EC50 values calculated from Hill plots. ‘NA’ = not measureable due to poor antiviral activity. See Supplementary Fig. 9 for additional details.

