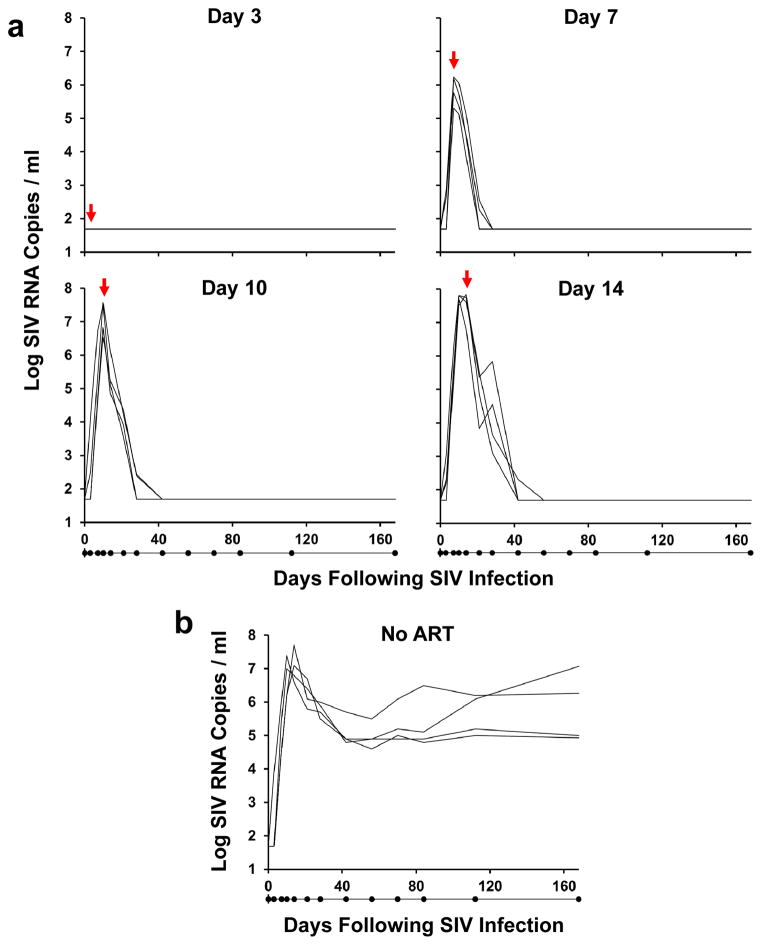
Figure 1. Viral decay kinetics after treatment with ART.
Log plasma viral RNA (copies/ml) in rhesus monkeys infected with SIVmac251 and following initiation of ART on days 3, 7, 10, and 14 of infection (a) or with no ART (b). Assay sensitivity is 50 RNA copies/ml. Red arrows indicate initiation of ART. Black dots below x-axis indicate sampling timepoints.

