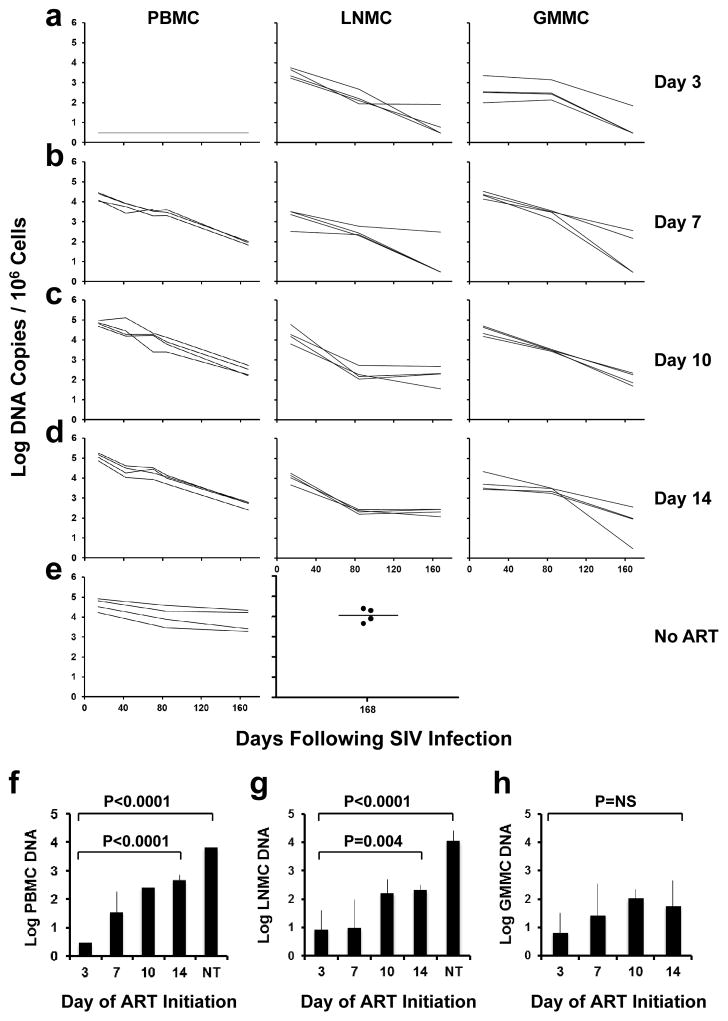
Figure 3. Proviral DNA during ART.
Log proviral DNA (copies/106 cells) in peripheral blood mononuclear cells (PBMC), lymph node mononuclear cells (LNMC), and gastrointestinal mucosa mononuclear cells (GMMC) in monkeys that initiated ART on days 3 (a), 7 (b), 10 (c), and 14 (d) of infection or with no ART (e). Comparisons of mean levels of log proviral DNA/106 cells at the time of ART discontinuation (week 24) in ART treated and untreated (NT) monkeys in PBMC (f), LNMC (g), and GMMC (h) are also shown (N=4 animals/group). Assay sensitivity is 3 DNA copies/106 cells. P-values reflect one-sided t-tests. Error bars reflect standard errors.

