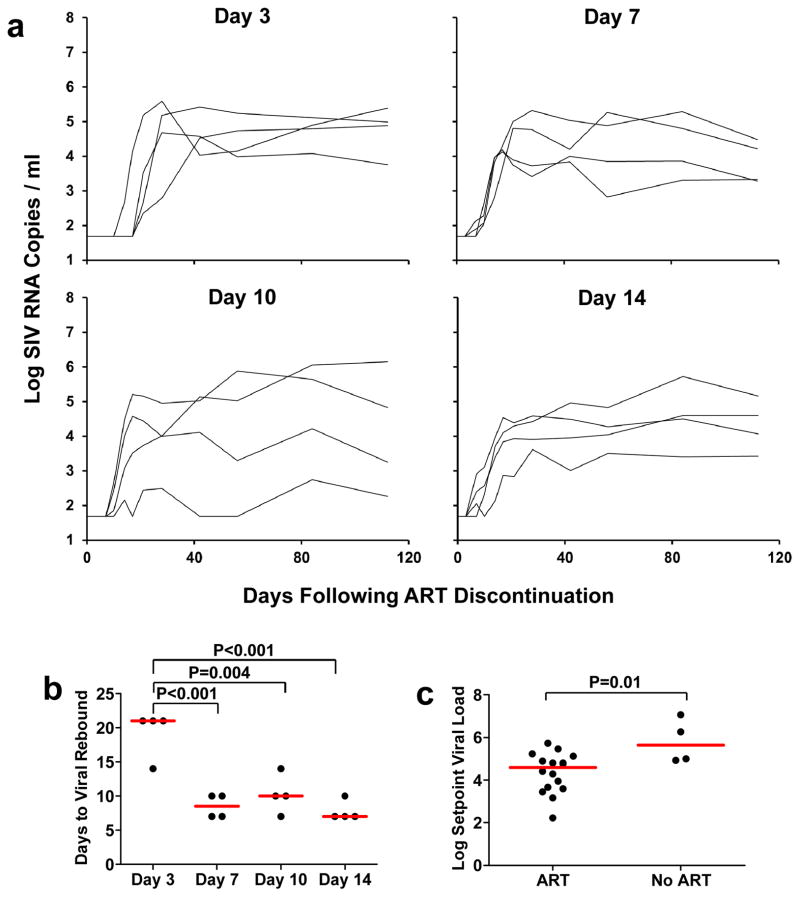
Figure 4. Viral rebound kinetics after ART discontinuation.
Log plasma viral RNA (copies/ml) in animals following discontinuation of ART at week 24 in monkeys that initiated ART on days 3, 7, 10, and 14 of infection (a). Assay sensitivity is 50 RNA copies/ml. Median times to viral rebound, defined as the first timepoint at which plasma viral RNA was >50 copies/ml, is also shown by the red bars (b). Median setpoint viral loads following viral rebound, defined as day 56–112 following ART discontinuation, are also shown by the red bars in ART treated monkeys compared with untreated monkeys (c). P-values reflect one-sided t-tests.

