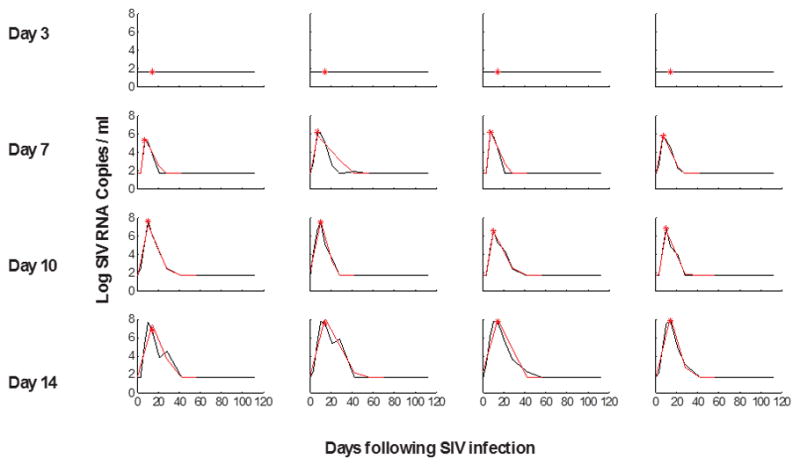
Extended Data Figure 1.

Viral dynamics modeling of initial viral growth and decay following ART initiation.
Red lines indicate fitted values from the model in monkeys that initiated ART on days 3, 7, 10, and 14 of infection and were utilized for AUC VL calculations. The red asterisk indicates the time of treatment initiation.
