
Figure 4.
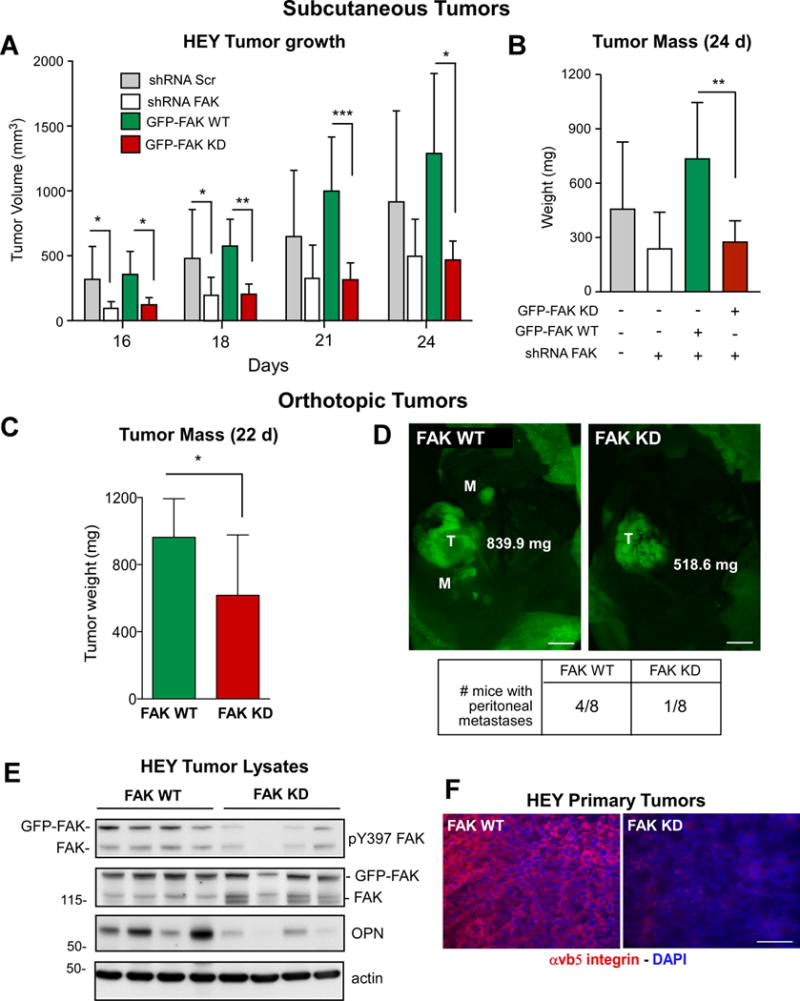
Genetic FAK inhibition prevents HEY tumor growth associated with decreased OPN and β5 integrin levels. A, mean subcutaneous tumor volume of Scr shRNA (gray, n=6), FAK shRNA (white, n=6), GFP-FAK WT- (green, n=5), and GFP-FAK KD-reconstituted (red, n=6) HEY cells at day 16 to 24 (+/− SD, * p< 0.05, ** p< 0.01; *** p<0.0001). B, final mean subcutaneous tumor mass in panel A (+/− SD, ** p< 0.01). C, Mean GFP-FAK WT (green, n=8), and GFP-FAK KD (red, n=8) HEY orthotopic tumor mass (+/− SD, *p< 0.05). D, representative orthotopic tumors (T) and peritoneal metastasis sites (M) as determined by GFP fluorescent imaging. Scale is 0.5 cm. E, lysates from four GFP-FAK WT or four GFP-FAK KD HEY orthotopic tumors analyzed by pY397 FAK, total FAK, OPN, and actin immunoblotting. F, fluorescent microscopic images of GFP-FAK WT and GFP-FAK-KD HEY tumor sections stained for αvβ5 integrin (red) and cell nuclei (blue). Scale is 100 μm.