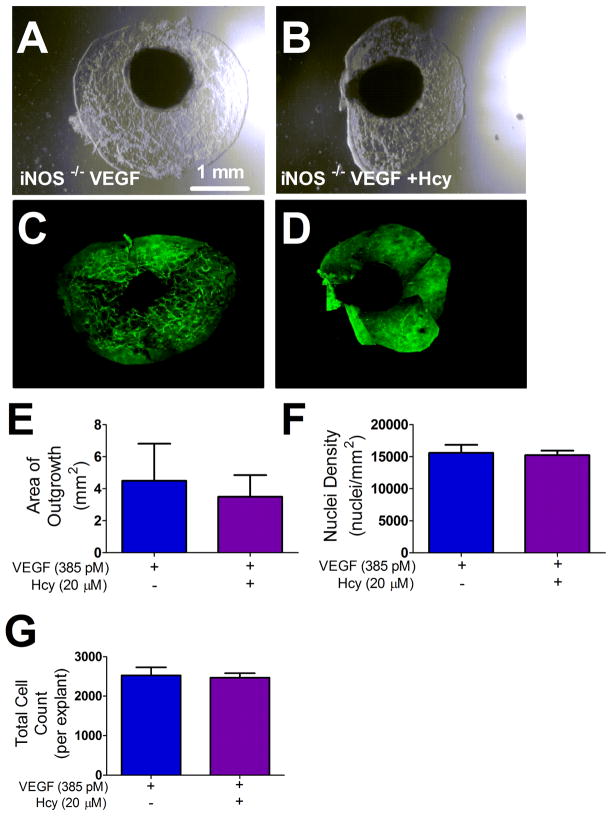
Figure 2. iNOS −/− Choroid Explant Outgrowth.
(A–B) DIC images of iNOS −/− explant outgrowth across treatments after four days of cell culture incubation with the corresponding fluorescence images of the same outgrowth labeled with isolectin B4 (C–D). (E) Area of outgrowth for iNOS −/− choroid explants treated as indicated for 4 days. * p < 0.05 from VEGF group, n=6. (P) Total cell count measured by the product of nuclei density and area of growth, n=6. (Q) Nuclei density of outgrowth, represented as nuclei per mm2, * p < 0.05 from VEGF group, n=6. E; explant, O; Outgrowth.

