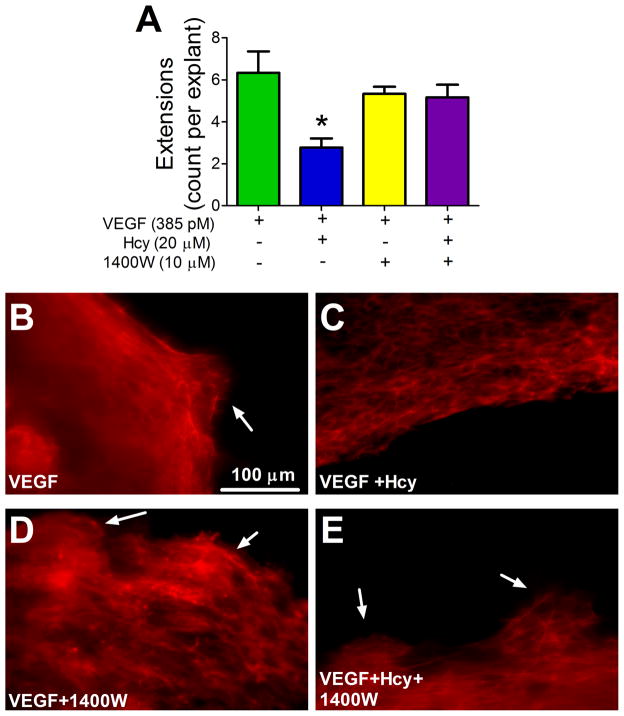
Figure 4. Actin Extensions at Leading Edge of Outgrowth.
(A) After four days, explants were labeled with phalloidin and a visually inspected using a fluorescent microscope to count the number of actin extensions present at the leading edge of outgrowth per explant, * p < 0.05 from VEGF, VEGF group n=6, VEGF+Hcy group n=9, VEGF+1400W group n=3, VEGF+Hcy+1400W n=6. (B–E) Representative images of F-actin extensions at leading edge, labeled with phalloidin. White arrows indicate extensions at leading edge of outgrowth.

