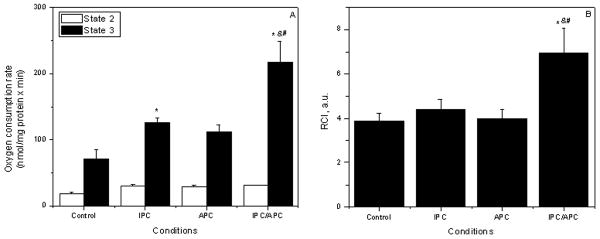
Figure 3.

Effects of APC and IPC on mitochondrial oxygen consumption. A, State 2 and State 3; B, respiratory control index (RCI). Oxygen consumption rates are given in nmol O/mg protein × min. The values shown are the means ± SEM of 9-14 experiments per group. *P<0.05 vs Control, &P<0.05 vs IPC; #P<0.05 vs APC.
