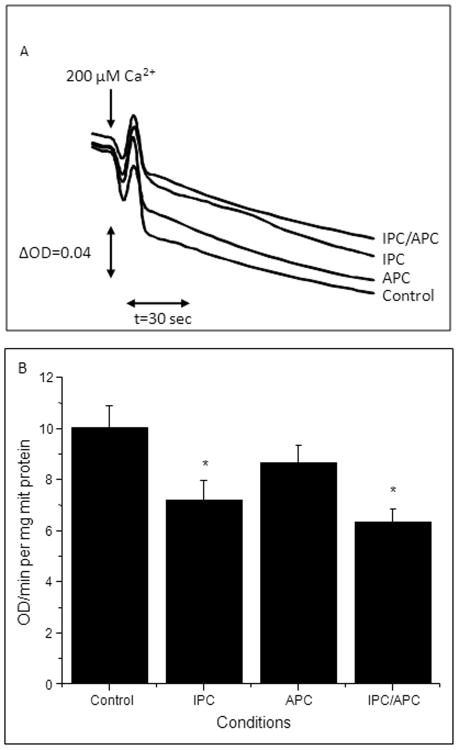
Figure 4.
Ca2+-induced mitochondrial swelling as an indicator of mPTP opening following IR. Measurement of the PTP under de-energized conditions was performed by monitoring the Ca2+-induced decrease in light scattering (A520). A, Original traces are shown for one mitochondrial preparation derived from hearts of Control, IPC, APC or IPC/APC groups. Matrix swelling was induced by 200 μM or 1 mM (maximal swelling) Ca2+. B, Rate of swelling of mitochondrial swelling induced by 200 μM CaCl2. Data are shown as a change of optical density (ΔOD)/min per mg of protein. The values shown are the means ± SEM of 9-14 experiments per group. *P<0.05 vs Control.

