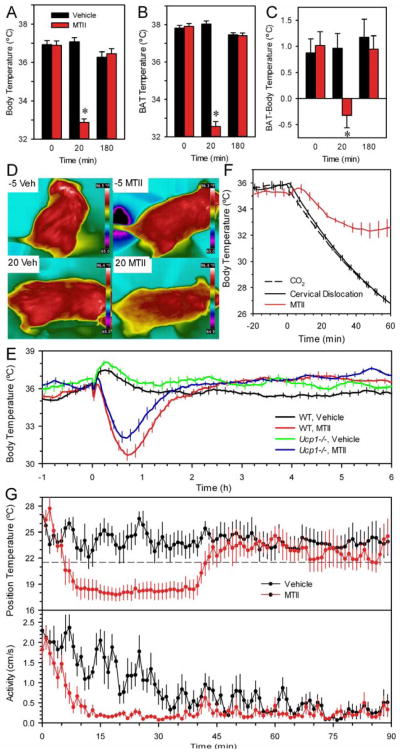
Figure 3.
Physiology of the hypothermic response to MTII. (A) Tb, (B) interscapular BAT temperature, and (C) the differential between BAT temperature and Tb in chow-fed C57BL/6J mice after MTII (red) or vehicle (black) treatment. Temperatures were measured at the indicated times after dosing. Data are mean ±SEM; n=6/group; * indicates p<0.05 vs vehicle (mean weight 27.5 g). (D) Infrared images of chow-fed mice taken 5 minutes before and 20 minutes after vehicle or MTII treatment using a Flir T400 camera and analyzed using Flir QuickReport 1.2 SP2 for measurement of temperatures within images. (E) Response of Ucp1−/− mice to MTII at 22 °C (body weight 26.1 ±1.6 g, n=8–10/group, crossover design, 8 male and 2 female). Every tenth SEM is shown for visual clarity. (F) Rate of heat loss in DIO mice. Mice were euthanized by carbon dioxide (black dashed line) or cervical dislocation (black solid line) at time 0. As a concurrent control, live mice were administered MTII (red). Ambient temperature was 21.6 °C (data are mean ±SEM; n=6–7/group; body weight 52.1 ±1.3 g). For visual clarity, every fifth SEM is graphed. (G) Choice of environmental temperature. Mice on a chow diet were treated with MTII (red) or vehicle (black) and immediately placed in a thermal gradient, with position monitored by video (n=8, crossover design). Ambient temperature was 21.6 °C (dashed line).

