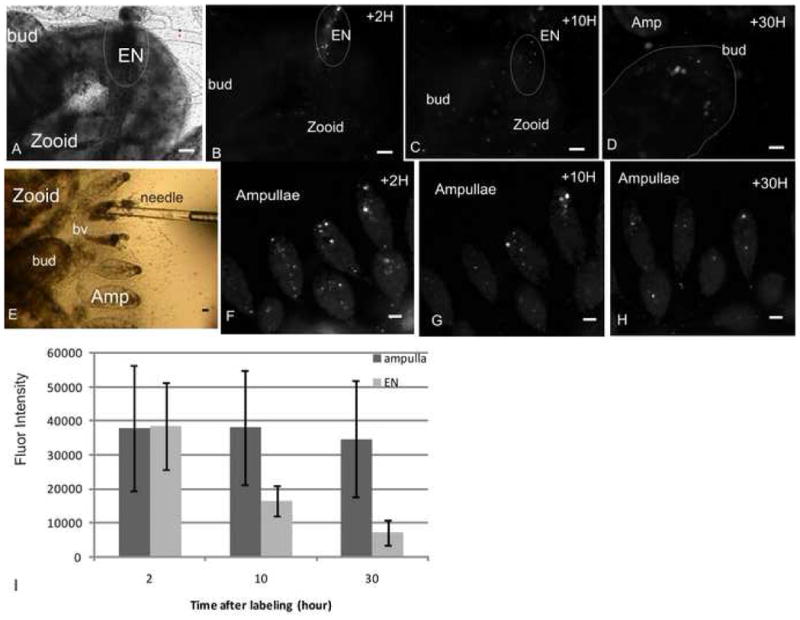
Fig 3. Fluorescent intensity of labeled cells.

A. EN (outlined) in a zooid (phase contrast image) and ~14 labeled cells within (B, fluorescent image), 2 hours post labeling. C. Same EN 10 hours post labeling, fluorescent intensity of the cells from the EN decreased and expansion of labeled cells in the zooid (~20 labeled cells) is observed. D. 30 hours post labeling ~14 labeled cells detected in the bud which was directly connected to the EN of the labeled zooid (panel A). At that time ~40 labeled cells were tracked in other buds of the colony. E. Injection of labeled cells into an ampulla by a glass needle. F. 2 hours post labeling, ~50 labeled cells detected in ampullae near the injected site. G. 10 hours post labeling ~ 17 labeled cells remained at this site, their fluorescence intensity did not decrease. H. 30 hours following labeling, ~12 cells detected in the labeling site, their fluorescence intensity remained unchanged. I. The average fluorescence intensity in labeled cells from ampullae versus cells from the EN as a function of time. EN-endostyle niche, H-hour, amp-ampulla, bv-blood vessel, scale bar=50μm.
