Figure 3.

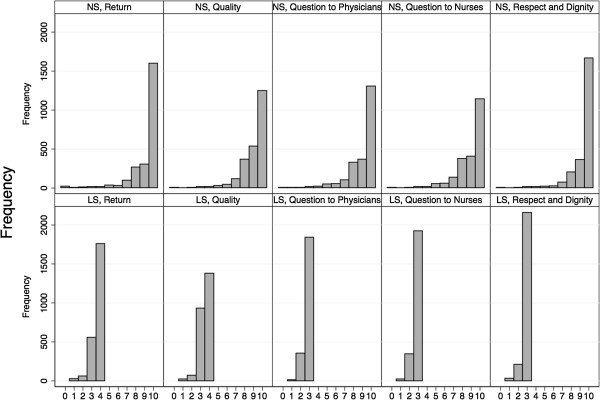
Questionnaire results on the numeric and labelled response scale. Frequency distribution of the answers to each item on both scales separately. NS = Numeric Scale, LS = Labelled Scale.

Questionnaire results on the numeric and labelled response scale. Frequency distribution of the answers to each item on both scales separately. NS = Numeric Scale, LS = Labelled Scale.