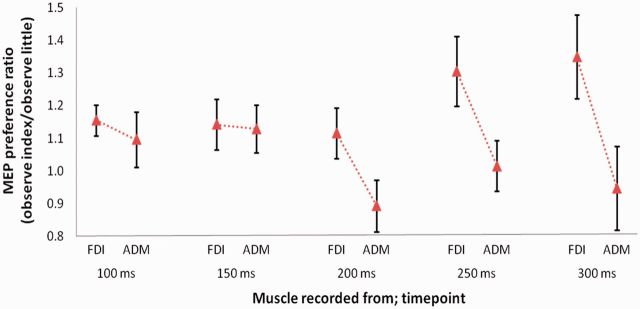
Fig. 2.

Experiment 1: Mean ± s.e.m. MEPs recorded from index and little finger muscles at five timepoints after observed action onset. For presentation purposes, MEP preference ratios are shown, calculated for each muscle as mean MEP size during observation of index finger actions divided by mean MEP size during observation of little finger actions. This ratio indicates the degree to which MEPs recorded in that muscle were greater for index than little finger action observation. A mirror effect is indicated by a higher value in the FDI (index finger muscle) than in the ADM (little finger muscle). All statistical analyses were applied to normalized MEP sizes. Significant mirror effects were found at 200, 250 and 300 ms.
