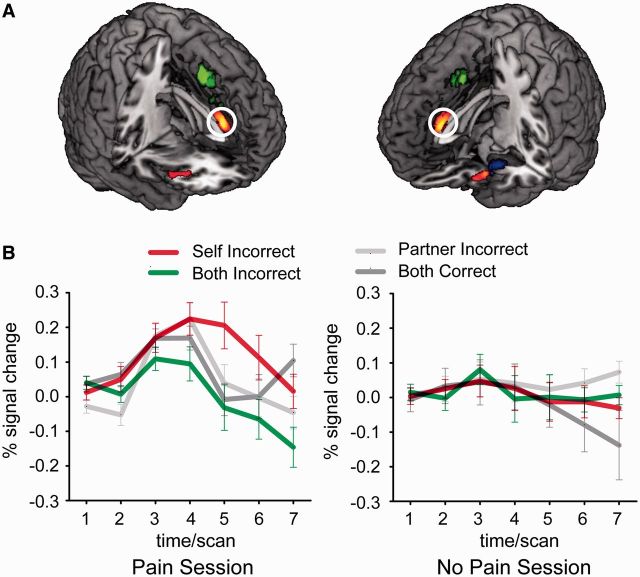
Fig. 2.
Results of the ‘Self_Incorrect > Both_Incorrect’ contrast and of the meta-analysis. (A) Results of the contrast ‘Self_Incorrect > Both_Incorrect’ in the first session is shown in yellow-to-red (P < 0.001 uncorrected, k > 50). Results of the meta-analysis of the emotion regulation literature are shown in green (regulation source) and blue (regulation site) (PFWE < 0.05). The activations observed in this study are clearly distinct from the source of emotion regulation. (B) Timecourse of percent fMRI signal change in the aMCC ROI in the first (Pain, left) and second (No Pain, right) session. The timecourse is locked to the onset of the estimation outcome. Error bars indicate standard error (s.e.m.).

