Fig. 4.
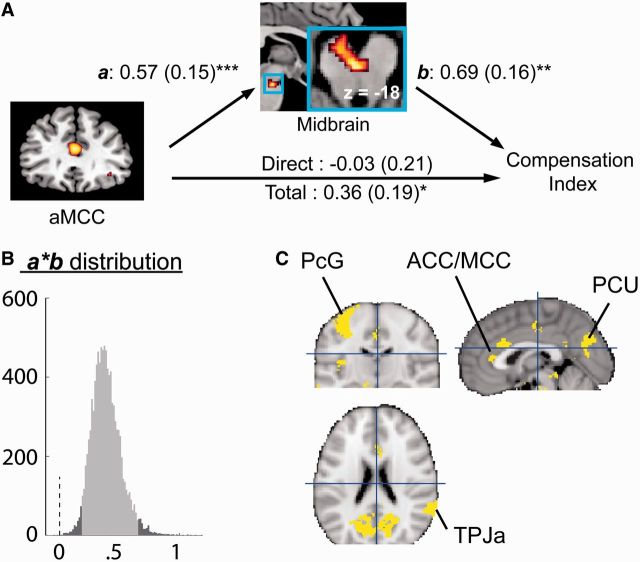
Mediation analysis results. (A) Path diagram shows the relationships between regions in the path model. The predictor region (aMCC) is shown on the left, which predicts activations in a midbrain nucleus. This is the a path for the mediator region. The mediator region’s connection to individual sensitivity to guilt (Compensation Index) is the b path. It was calculated controlling for aMCC activity. The lines are labeled with path coefficients, and standard errors are shown in parentheses. The direct path was calculated controlling for the mediator. (B) The bootstrapped mediation effect (path a*b) for the aMCC. (C) Results of the whole-brain exploratory MEPM analysis for indirect cortical influence of Compensation Index, whose effect is mediated by the midbrain. Activation clusters are shown at qFDR < 0.05. Confirming the ROI-based analysis, the ACC/MCC is within the cortical network that influences Compensation Index indirectly via the midbrain. ***P < 0.001, **P < 0.01, *P < 0.05, two-tailed.

