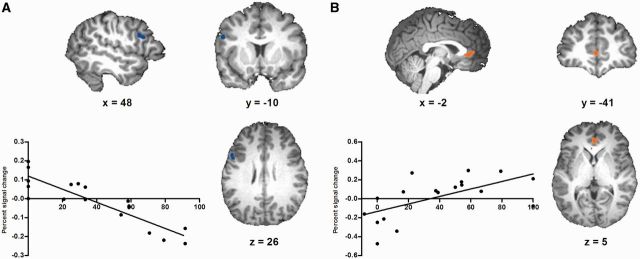
Fig. 3.

Clusters identified by whole-brain linear regression analyses for the low (A) and high (B) psychopathy group in the Unfair > Fair contrast. (A) In the low psychopathy group, difference scores of acceptance rates were negatively associated with activity in the dlPFC, such that higher activation in this region was associated with increased acceptance of unfair offers. The scatter plot depicts the association between mean percent signal changes extracted from that cluster and difference scores. (B) In the high psychopathy group, difference scores of acceptance rates were negatively associated with activity in the rostral ACC/vmPFC, such that higher activation in this region was associated with increased rejection of unfair offers. The scatter plot depicts the association between mean percent signal changes in that cluster and difference scores.
