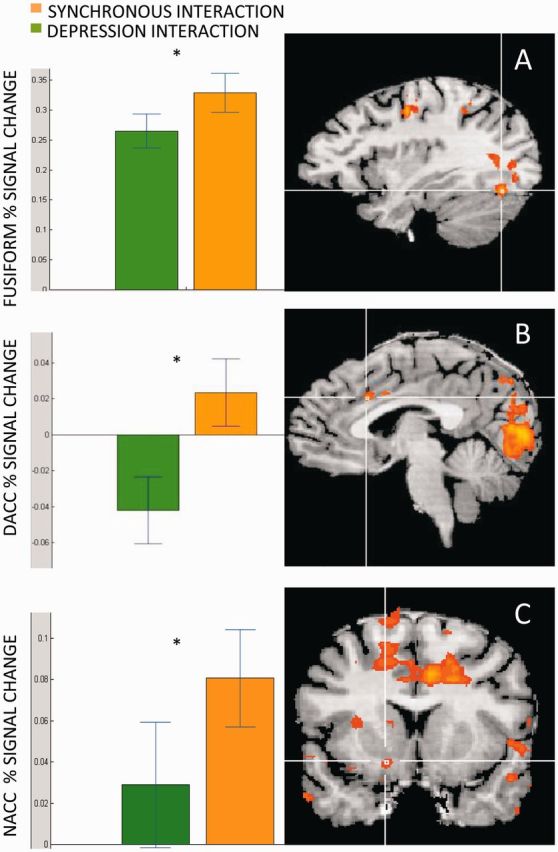
Fig. 3.

Brain areas showing greater response to the synchronous compared to the depressed interaction. Fusiform (A), dACC (B) and NACC (C) showed greater activations when mothers observed the synchronous interaction (orange) compared to the depression interaction (green).
