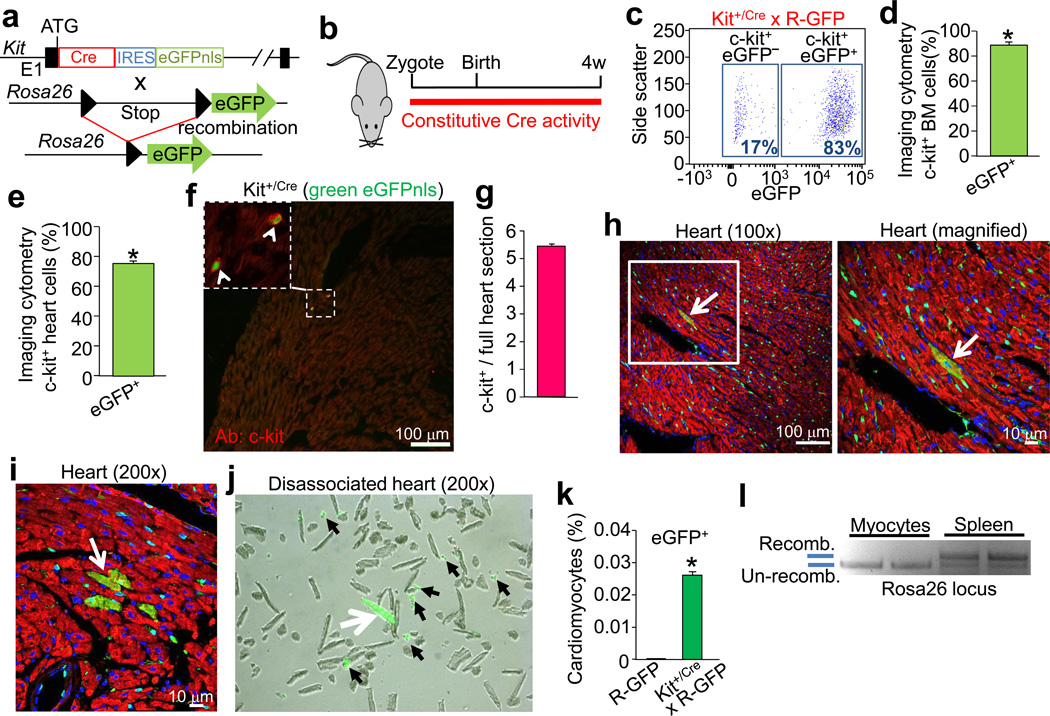
Figure 1. Kit-Cre lineage tracing.
a, The Kit locus was targeted in mice to express Cre recombinase and eGFP with a nuclear localization sequence (eGFPnls) from an internal ribosome entry site (IRES). These mice were crossed with Rosa26 reporter mice (R-GFP) for lineage tracing. b, Diagram of mice used for all experimentation in this figure. c, Representative flow cytometry (FACS) plot of bone marrow from Kit+/Cre × R-GFP mice gated for c-kit antibody, then eGFP fluorescence to reflect recombination of the R-GFP locus (representative of n=6 total). d, Direct imaging cytometry analysis of eGFP expression in bone marrow (n=3, *P<0.05 vs R-GFP). e, same quantitative imaging cytometry analysis as in d except the non-myocytes were isolated from hearts of Kit+/Cre × R-GFP mice (n=3 hearts, *P<0.05 vs R-GFP). f, Immunohistochemistry to show current expression from the Kit-Cre allele (green, eGFPnls) versus endogenous c-kit protein detected by antibody (red). The inset box shows 2 mononuclear c-kit expressing cells. g, Quantitation of average number of c-kit+ cells per longitudinal heart section (n=4 hearts) h, Representative histological section at 2 magnifications (white box) of a Kit+/Cre × R-GFP mouse heart with desmin antibody in red, eGFP antibody in green, and nuclei in blue. The arrow shows an eGFP+ cardiomyocyte. i, Immunohistological image showing a rare area of cardiomyocyte clonal expansion (arrow). j, Image of cells disassociated from the hearts of Kit+/Cre × R-GFP mice. White arrow shows a rare eGFP fluorescing cardiomyocyte, while the black arrowheads show eGFP fluorescent non-myocytes. k, Quantitation of eGFP+ fluorescent cardiomyocytes (81 from 303,264 total cardiomyocytes, 3 hearts,*P<0.05 vs R-GFP). l, DNA electrophoresis after PCR showing Cre-mediated Rosa26 locus recombination in semi-purified cardiomyocytes and spleen (n=2 each). All error bars represent s.e.m.

