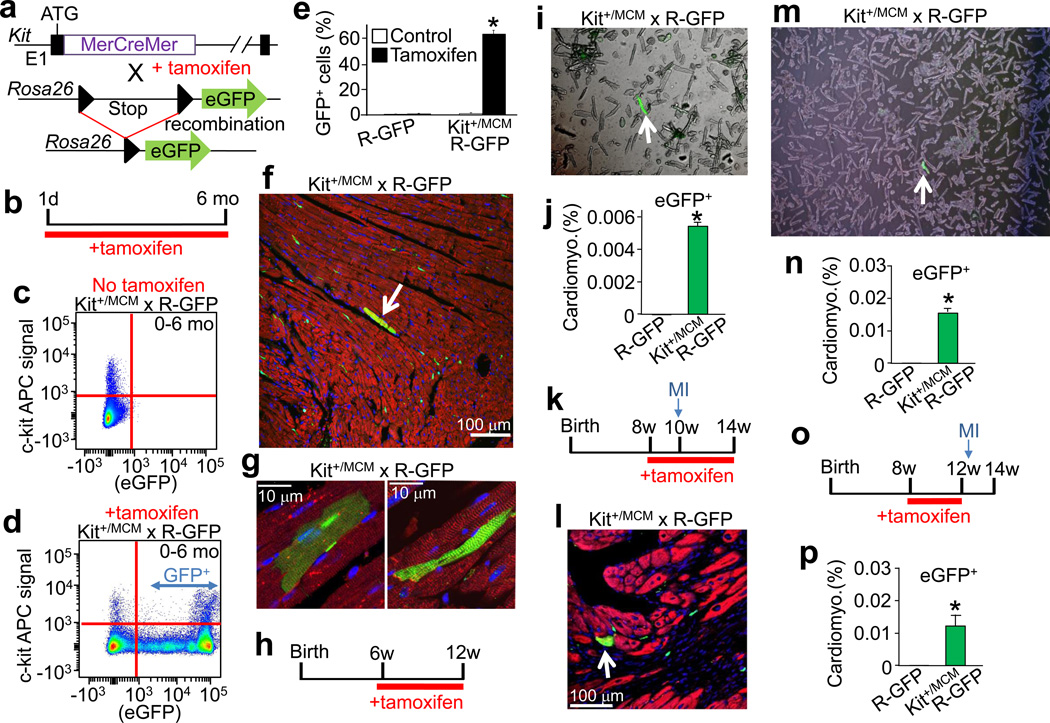
Figure 3. Inducible Cre expression from the Kit locus shows limited adult cardiomyocyte formation.
a, Genetic cross between Kit+/MCM and R-GFP reporter mice to lineage trace c-kit expressing cells when tamoxifen is present. b, Schematic showing tamoxifen treatment between day 1 and 6 months of age (panels c–g). c, d, Representative FACS plots with c-kit antibody (APC) vs eGFP from bone marrow of Kit+/MCM × R-GFP mice without (c) or with tamoxifen (d). e, FACS quantification of eGFP+ cells from bone marrow of these mice (n=2 mice for R-GFP and n=4 for Kit+/MCM × R-GFP). *p<0.05 vs R-GFP. f, g, Representative heart sections from Kit+MCM × R-GFP mice showing c-kit+ lineage cells in green and cardiomyocytes in red (desmin antibody). White arrow indicates eGFP+ adult cardiomyocyte. h,i,j, Tamoxifen treatment of Kit+/MCM × R-GFP mice between 6 – 12 weeks of age followed by disassociation of cells from the hearts of these mice in h (white arrow shows rare cardiomyocyte) that is quantified in j (127,284 cardiomyocytes across 2 hearts, 7 were eGFP+,*P<0.05 vs R-GFP). k,l,m,n, Tamoxifen treatment of Kit+MCM × R-GFP mice between 8 and 14 weeks of age with myocardial infarction (MI) on week 10. l, Immunohistological heart section for desmin (red) and eGFP (green) with nuclei in blue (arrow shows a cardiomyocyte from the c-kit+ lineage). m, n, Disassociated cardiomyocytes show rare but definitive myocyte labeling (white arrow), which was quantified in n (225,760 cardiomyocytes from 2 MI hearts, 37 were eGFP+,*P<0.05 vs R-GFP). o,p, Tamoxifen treatment between 8 – 12 weeks of age with MI injury occurring 3 days after tamoxifen cessation. p, Quantitation of eGFP+ cardiomyocytes from histological images taken from 2 hearts of these mice. eGFP+ cardiomyocytes were quantified as a percentage of the total cardiomyocyte fraction in >50 histological sections across the entire heart. *P<0.05 vs R-GFP. All error bars represent s.e.m.

