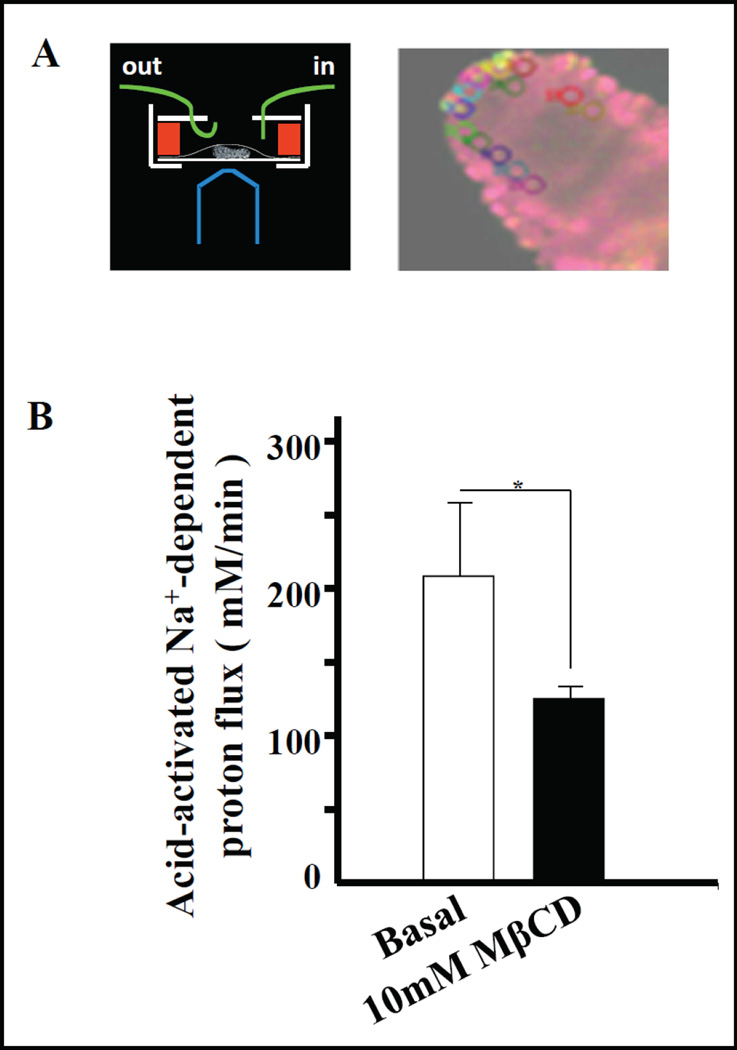
Fig. 5.
Modulation of NHE3 activity by cholesterol extraction. A) Schematic diagram of the villus perfusion chamber, and screenshot of BCECF-loaded villus with areas of interest (ROI) outlined. The villus has changed its dimension since placement of the ROIs, and the stored images of each experiment are rerun and the ROIs retraced after its completion. Pseudocolours indicate the 490/440 ratio. B) The activity of NHE3 in membrane rafts was estimated by measuring acid-activated Na+-dependent proton flux (mM/min) before and after disruption of rafts using 10mM MβCD superfusion for 10 min. NHE3 activity was reduced by ~22% after MβCD treatment. n=4 (p<0.05).

