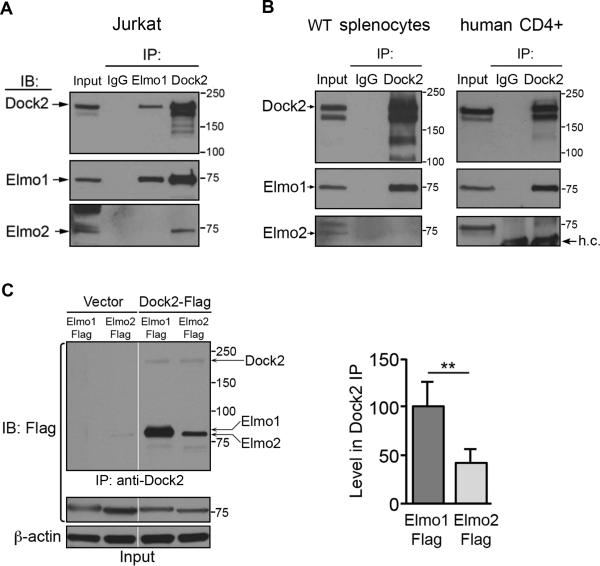
Figure 4. Dock2 interaction with Elmo1 and Elmo2.
(A) IP of Jurkat lysates with control rabbit IgG or anti-Dock2 followed by IB with antibodies indicated left. IP's were divided equally and loaded in separate wells for blotting with either anti-Elmo1 or anti-Elmo2. (B) IP of lysates from WT mouse splenocytes (left) and primary human CD4+ T cells (right) as in (A). One representative experiment of three for A and B is shown. h.c., heavy chain of IgG. (C) 293T cells were transfected with vector, Dock2-Flag, Elmo1-Flag or Elmo2-Flag plasmids followed by lysis and IP with anti-Dock2 or control IgG. IP's and total lysates (input) were analyzed by IB with anti-Flag-HRP. Right, the level of Elmo1-Flag and Elmo2-Flag present in anti-Dock2 IP's was normalized to input levels and the relative level of each in Dock2 IP's was calculated. The average of n = 3 ±SEM is shown right. Relative molecular weights (kDa) are indicated to right of blots.

