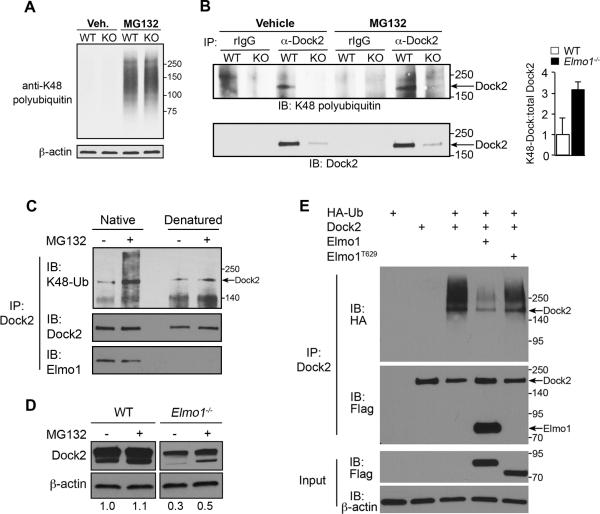
Figure 7. Posttranslational regulation of Dock2 in T cells.
(A) Splenic CD4+ T cells from WT and Elmo1−/− mice were treated with the proteasome inhibitor MG132 for 3 hours, lysed and analyzed by IB using an antibody that recognizes K48-linked lysines of polyubiquitin chains or β-actin. (B) Splenic CD4+ T cells from WT and Elmo1−/− mice were treated as in A, followed by IP with anti-Dock2 or control rabbit IgG. IP's were analyzed by IB with anti-K48 ubiquitin (above) and anti-Dock2 (above). Arrows indicate position of Dock2 bands. Graph right shows relative levels of K48-Dock2 normalized to total Dock2 in IP. n = 2 mice/genotype, ±SEM. (C) WT splenic CD4+ T cells were treated 3 hours with 10μM MG132 followed by lysis and anti-Dock2 IP. Half of each IP was then denatured (5 minutes at 95°C) followed by a second round of anti-Dock2 IP before the denatured and nondenatured (“native”) fractions were analyzed by anti-K48 ubiquitin IB. (D) Splenic CD4+ T cells from WT and Elmo1−/− mice were treated with MG132 for 6 hours and total cell lysates were analyzed by IB using the indicated antibodies. Values below indicate the relative levels of Dock2 protein normalized to β-actin in each sample as determined by densitometry. Results are representative of three independent experiments. (E) 293T cells were transfected with indicated plasmids for 24 hours followed by anti-Dock2 IP of lysates and IB with indicated antibodies. Results are representative of three independent experiments. Relative molecular weights (kDa) are indicated to right of blots.

