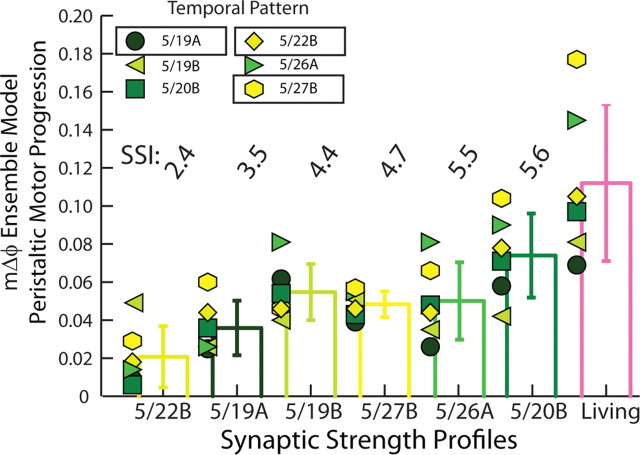
Figure 7.
Peristaltic motor phase progression in the ensemble model when the six temporal patterns were matched with each of the six synaptic strength profiles. Each symbol (color code: Fig. 2A1) is the peristaltic motor phase progression between the HE(8) and HE(12) model motor neurons when the temporal pattern (indicated by the appropriate symbol) is matched with the given synaptic strength profiles indicated on the horizontal axis. The peristaltic motor phase progression measured in the living system for each of the six experimental preparations in the physiological data set is also shown. The bars indicate the mean motor phase progression for the given synaptic strength profiles across temporal patterns ± SD. Synaptic strength profiles are listed in order of increasing SSI.

