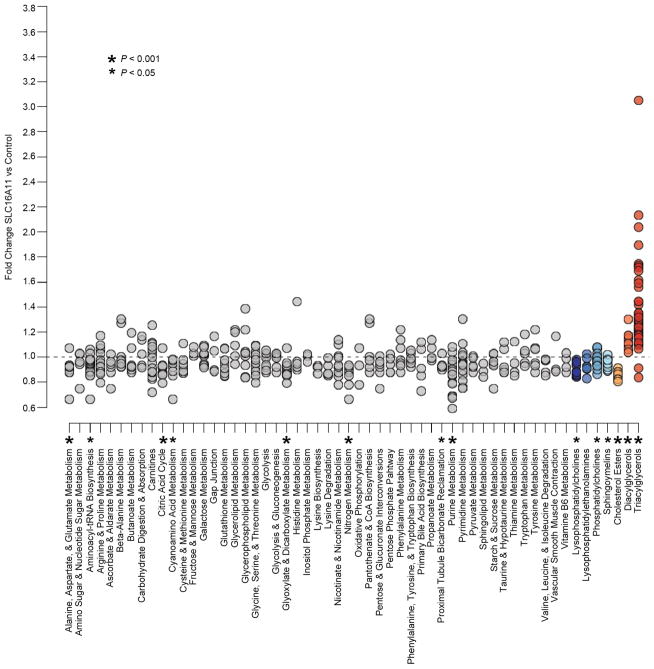
Extended Data Figure 10. Pathway and class-based metabolic changes induced by SLC16A11 expression.
Changes in metabolite levels in HeLa cells expressing SLC16A11-V5 compared to control-transfected cells are plotted in groups according to metabolic pathway or class. Pathways shown include all KEGG pathways from the human reference set for which metabolites were measured as well as eight additional classes of metabolites covering carnitines and lipid sub-types. Each point within a pathway or class shows the fold-change of a single metabolite within that pathway or class. For each pathway or class with at least six measured metabolites, enrichment was computed as described in Online Methods. Asterisks indicate pathways with P ≤ 0.05 and FDR ≤ 0.25. Supplementary Table 14 shows additional details from the enrichment analysis.

