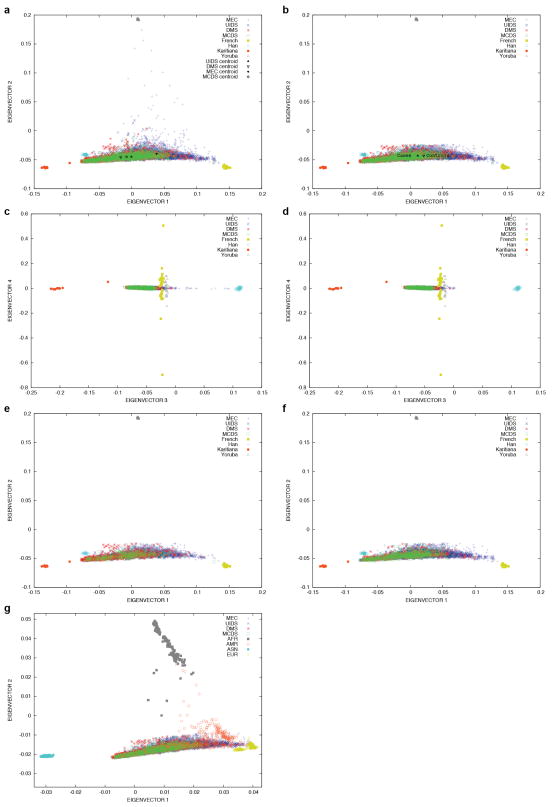
Extended Data Figure 1. Principle component analysis (PCA) projection of SIGMA samples onto principal components calculated using data from samples collected by the Human Genome Diversity Project (HGDP).
PCA projection of SIGMA onto HGDP Yoruba, French, Karitiana and Han (Chinese) populations (a) before ancestry quality control filters were applied, with cohort centroids as indicated and (b) after all quality control filters were applied, with case and control centroids as indicated. Principal components 3 and 4 (c) before filtering samples on ancestry (a small number of samples in the MEC cohort show East Asian admixture) and (d) after all quality control filters were applied. Additional plots as in (b) but separating (e) cases and (f) controls.

