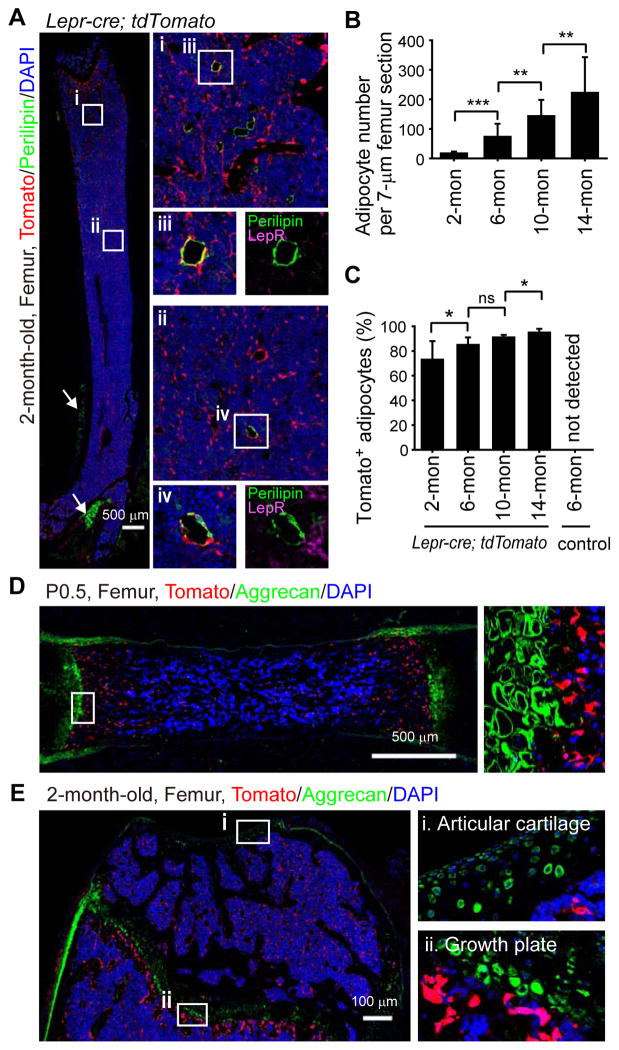
Figure 3. LepR+ cells give rise to most bone marrow adipocytes but to few chondrocytes.
(A) Representative femur sections from a 2-month-old Lepr-cre; tdTomato mouse. Perilipin+ adipocytes in the bone marrow did not stain with an anti-LepR antibody (purple) but were Tomato+ (red). Periosteal adipocytes (arrows) were uniformly Tomato negative (representative of 4 mice from 4 independent experiments).
(B and C) Quantification of adipocyte number per 7 μm femur section (B) and the percentage of adipocytes that were Tomato+ at each age (C) in Lepr-cre; tdTomato mice. Two-tailed Student’s t-tests were used to assess statistical significance. ns, not significant, *P<0.05, **P<0.01, ***P<0.001. (n=3–5 mice/age from at least 3 independent experiments).
(D and E) Aggrecan+ chondrocytes were not Tomato+ in P0.5 (D) or 2-month-old (E) Lepr-cre; tdTomato mice (n=3–5 mice/age from at least 3 independent experiments).

