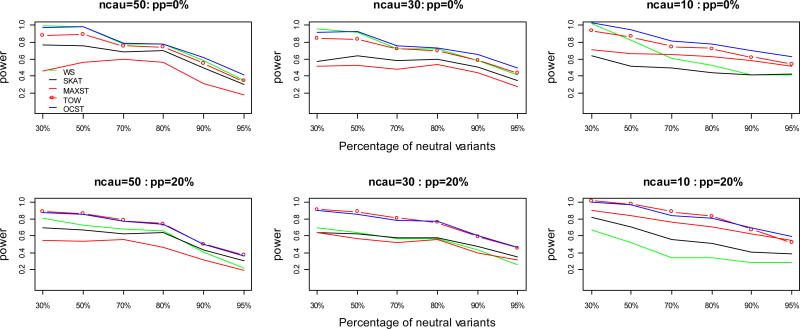
Figure 1.
Power comparisons of the five tests for power as a function of the percentage of neutral variants under model 1 for quantitative traits. ncau represents the number of causal variants. pp represents the percentage of protective variants. In this set of simulations, sample size is 1000; significance level is 0.001; total heritability is 0.05. Tn=ncau/(1−pn), where Tn represents the total number of variants and pn represents the percentage of neutral variants, and the Tn variants are randomly chosen from the 1057 variants of Sgene.

