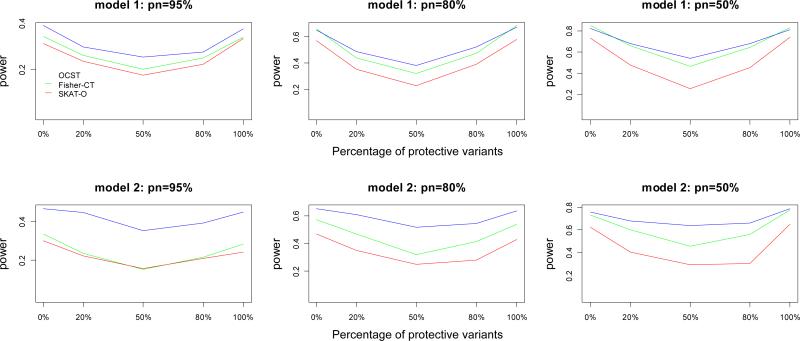
Figure 4.
Power comparisons of three tests (OCST, Fisher-CT, and SKAT-O) for power as a function of the percentage of protective variants for quantitative traits. The number of causal variants is 20. pn represents the percentage of neutral variants. In this set of simulations, sample size is 1000; significance level is 0.001; total heritability is 0.05. Tn=ncau/(1−pn), where Tn represents the total number of variants and ncau represents the number of causal variants, and the Tn variants are randomly chosen from the 1057 variants of Sgene.

