
Figure 3. Group Main Effect (A) Physiology and Behavior Results.
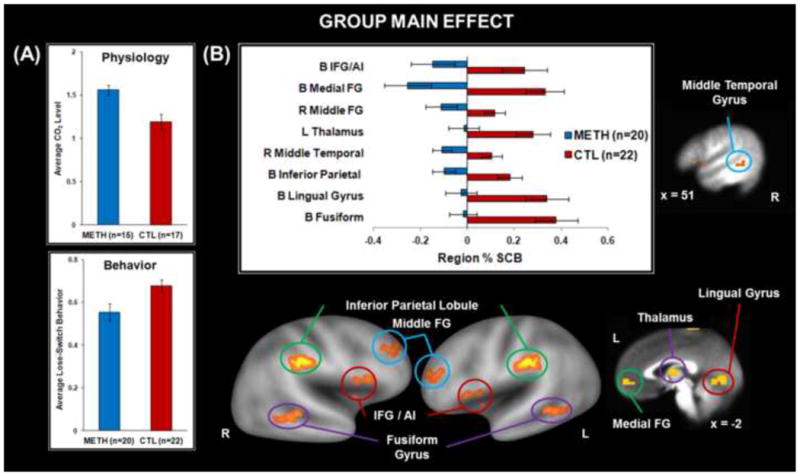
Methamphetamine use disorder (METH) subjects exhibited lower carbon dioxide (CO2) levels across interoception conditions/error rates and lower lose-switch behavior across error rates than healthy comparison subjects (CTL); (B) Neuroimaging Results. METH exhibited lower percent signal change from baseline (% SCB) than CTL in inferior frontal gyrus (IFG), anterior insula (AI), medial frontal gyrus (FG), middle frontal gyrus, thalamus, middle temporal gyrus, inferior parietal lobule, lingual gyrus, and fusiform gyrus. B = bilateral, L = left, R = right. Error bars indicate ±1 standard error of the mean.