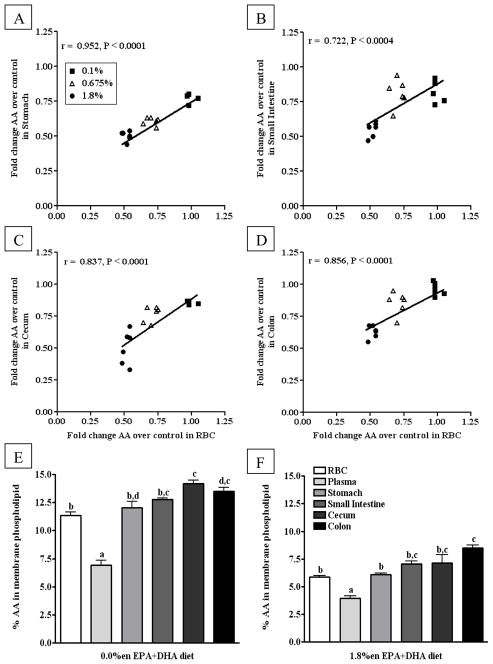
Figure 4. Comparison of AA content in phospholipid fatty acids from blood and gastrointestinal tissues from mice fed diets with increasing EPA+DHA.
(A–D) Fold Change in AA content over the control group in phospholipid fatty acids from gastrointestinal tissues correlated to AA content in phospholipid fatty acids from red blood cells: (A) Stomach, (B) Small Intestine (C) Cecum, (D) Colon. Data from the tissues of mice fed experimental diets containing EPA+DHA-enriched fish oil were normalized to the control group to assess fold changes in AA content of phospholipids. A Pearson correlation was used to test linear correlation between gastrointestinal tissue AA fold change and RBC AA fold change (n = 18). (E–F) The AA content from phospholipid fatty acids across blood and gastrointestinal tissues from mice fed either the control (E) or 1.8%en EPA+DHA diet (F) (n = 6/group). A one-way ANOVA and a Tukey’s post-hoc were used to assess differences in AA content comparing all tissues to each other. Differing letters denote statistical significance at P < 0.05.

