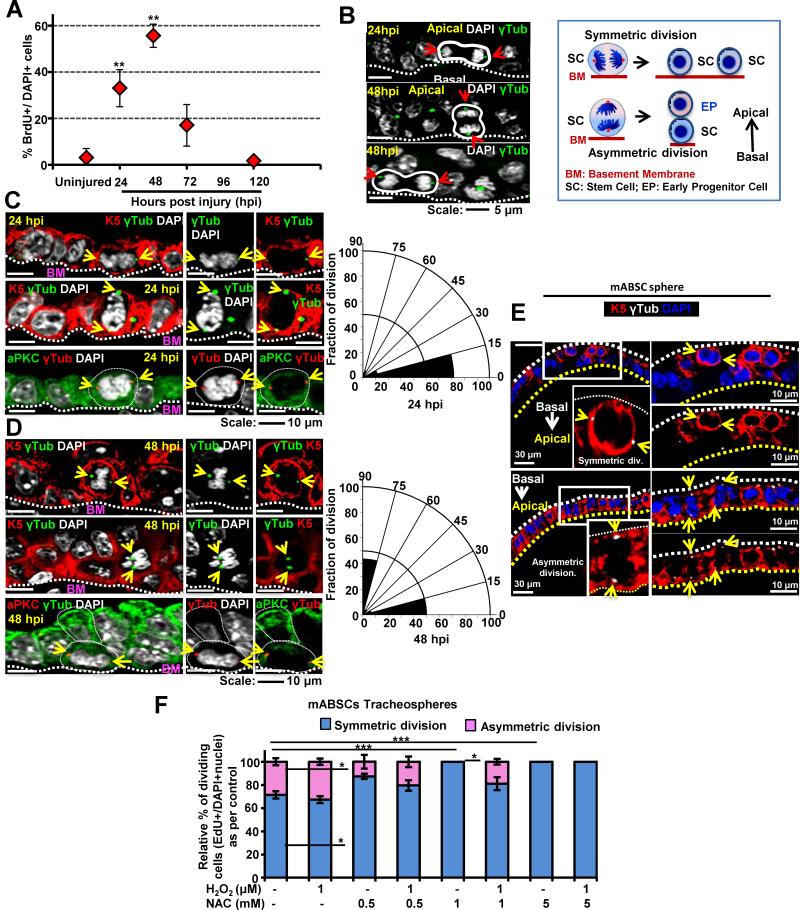
Figure 2.
Characterization of the Polidocanol In Vivo Airway Epithelial Injury Model and Elucidation of Symmetrical Versus Asymmetrical ABSC Division During Repair After Injury (A) Graph representing the time course of in vivo epithelial proliferation for repair (% of BrdU+ve epithelial cells as compared to all DAPI+ nuclei) at different hpi. Data are presented as mean ± SEM, (n = 10).
(B) DAPI staining of metaphase chromosomes and γ-tubulin immunostaining of centromeres in ABSCs (yellow arrows) demonstrates the plane of polarity for symmetrical versus asymmetrical division. Cartoon of symmetrical versus asymmetrical division. SC= stem cell, PC = progenitor cell, BM= basement membrane.
(C, D) The number of symmetrical versus asymmetrical cell divisions in the repairing airway epithelium at 24 hpi (C) and 48 hpi (D) was quantified with γ-tubulin and the polarity marker aPKC in radial histograms where symmetric divisions have spindle angles of 0 ± 30° while asymmetric divisions have spindle angles of 90 ± 30° in relation to the basement membrane.
(E) Symmetric and asymmetric division of mABSCs in tracheosphere cultures. γ-tubulin (white), K5 (red)
(F) Quantification of the spindle angle of dividing mABSCs in sphere cultures in the presence of varying concentrations of NAC and H2O2.
All data are presented as mean ± SEM. * P < 0.05, ** P < 0.01 and *** P < 0.001.
See also Figure S2.

