Fig. 4.

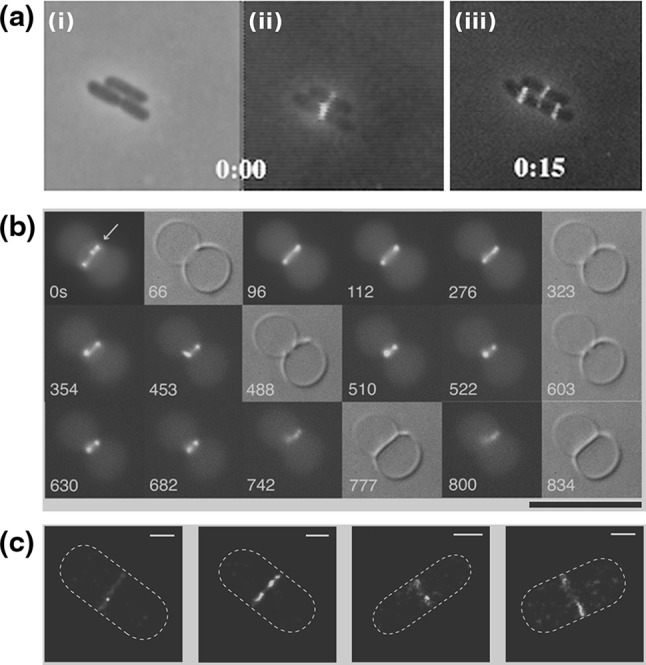
FtsZ in the cytokinesis of cells and liposomes. a Localization of the Z-ring during the cell cycle of E. coli. i Phase-contrast image of three cells. ii Overlay of a phase-contrast image and a conventional fluorescence microscopy image of FtsZ–GFP. iii Overlay of a phase-contrast image and a conventional fluorescence microscopy image of FtsZ–GFP after 15 min. Note that initially one FtsZ ring appears in the lower cell, while two new rings appears in the two daughter cells after the mother cell has divided. b Time lapse recording of the formation of a septum between two liposomes containing equimolar FtsZ–YFP and a mutant  proteins, together with GTP and ATP. Time represents seconds after the start of the recording. Black background images are epi-fluorescence images while gray background images are DIC ones. c Four high-resolution images of the Z-ring in E. coli cells (PALM images of FtsZ–Emos2). Note the inhomogeneity of the fluorescence intensity, indicating that the Z-ring is not a perfect continuous filament. Scale bar 500 nm. Initially, an FtsZ arc is seen localized at a constriction site. After several spatial reorganization steps, the system seems to end up in an intra-vesicular septum. Scale bar 10
  . a Modified with permission from reference Sun and Margolin (1998)
  (1998) American Society of Microbiology. b Modified with permission from reference Osawa and Erickson (2013)
  (2013) National Academy of Sciences, USA. c Modified from reference Fu et al. (2010) under the Creative Commons Attribution (CC BY) license http://creativecommons.org/licenses/by/3.0/. (Color figure online)
