
Figure 2.
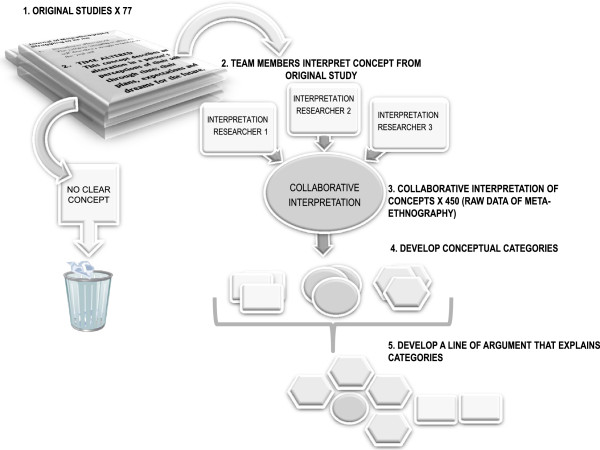
Analysis. Figure 2 illustrates the process of analysis from [1] 77 original studies, [2] team members’ interpretation of the concepts from the original studies, [3] developing collaborative interpretations of 450 concepts (the raw data), [4] developing conceptual categories through constant comparison and [5] developing a line of argument to explain the conceptual categories.