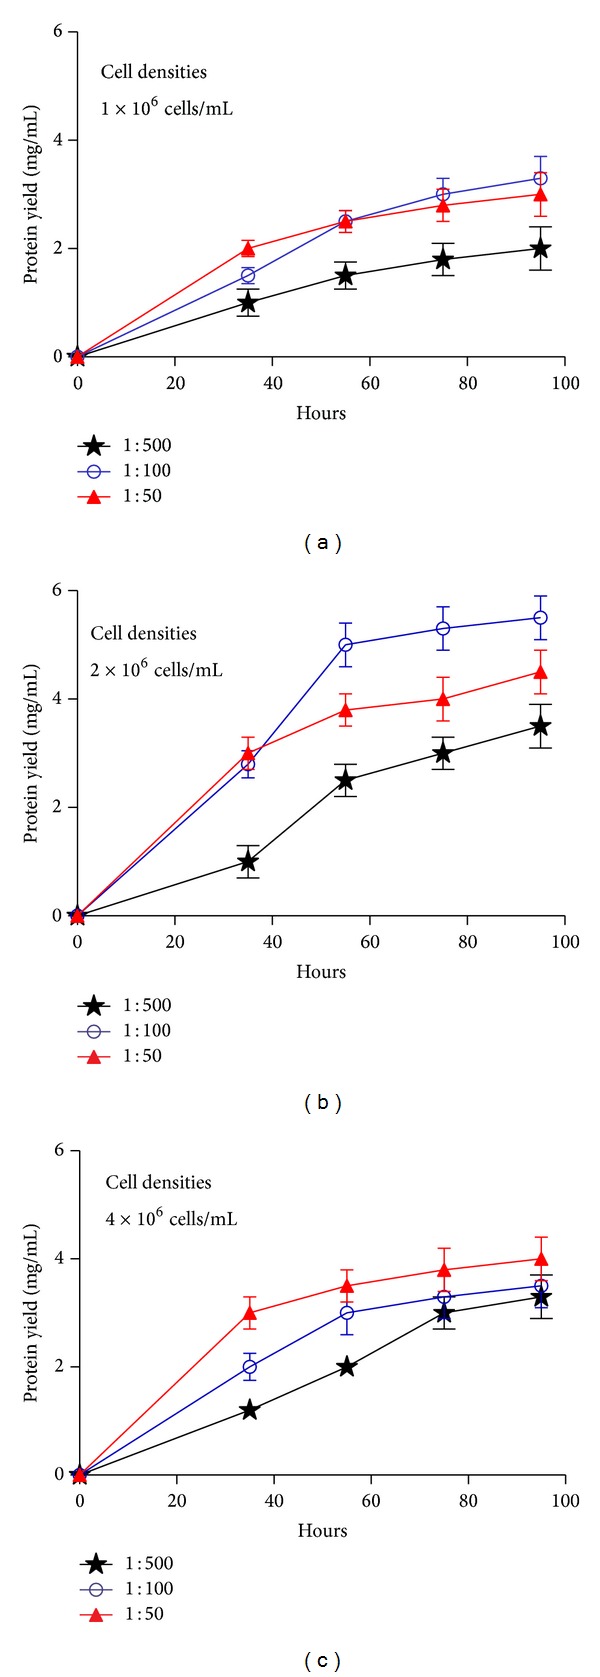
Figure 4.

Optimization of Ac-AChBP expression. (a) Cell densities 1 × 10⁶ cells/mL, at different volume of the infecting baculovirus inoculums (1 : 50, 1 : 100, and 1 : 500) were monitored at different time (35 h, 55 h, 75 h, and 95 h). (b) Cell densities 2 × 10⁶ cells/mL, at different volume of the infecting baculovirus inoculums were monitored at different time. (c) Cell densities 4 × 10⁶ cells/mL, at different volume of the infecting baculovirus inoculums were monitored at different time points.
