
Figure 2.
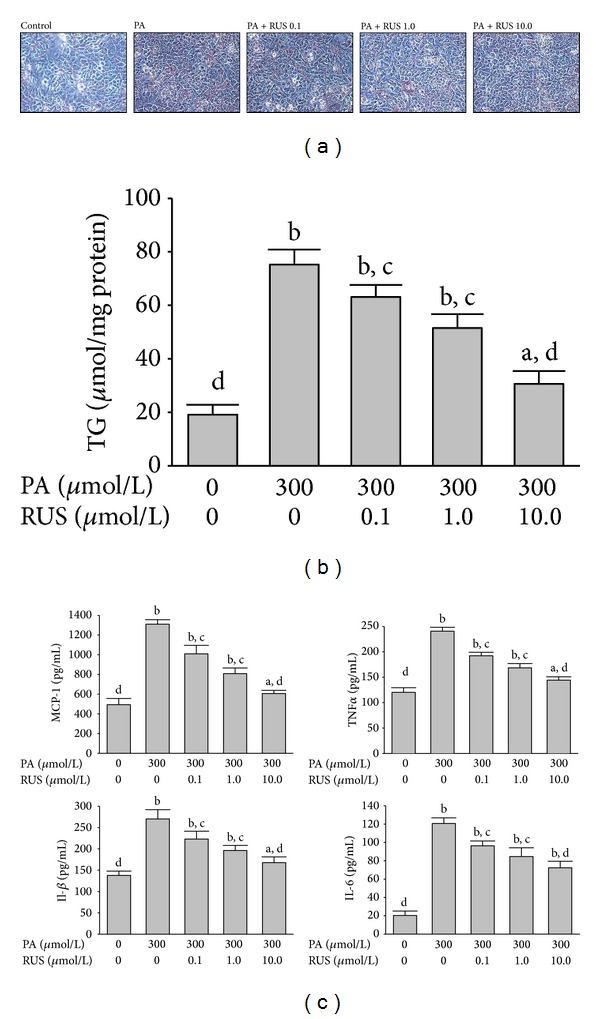
Effects of ruscogenin (RUS) on PA-induced lipids accumulation and inflammatory cytokines overproduction in HepG2 cells. Cells were exposed to PA (300 μmol/L) for 24 h with or without the preincubation of 0.1 (RUS 0.1), 1.0 (RUS 1.0), or 10.0 μmol/L ruscogenin (RUS 10.0). (a) Representative Oil Red O staining of cells with different treatments is shown. Cells were examined by light microscopy at a magnification of 400x. (b) Intracellular TG content was measured by an ELISA assay. TG concentration was normalized by protein content. (c) Inflammatory cytokines in cell-free culture supernatants were determined by ELISA kits. The results are presented as the mean ± SEM of four experiments. a P < 0.05 and b P < 0.01 compared to the control values of untreated cells (control), respectively. c P < 0.05 and d P < 0.01 compared to the values of PA-treated cells (PA), respectively.