Figure 4.

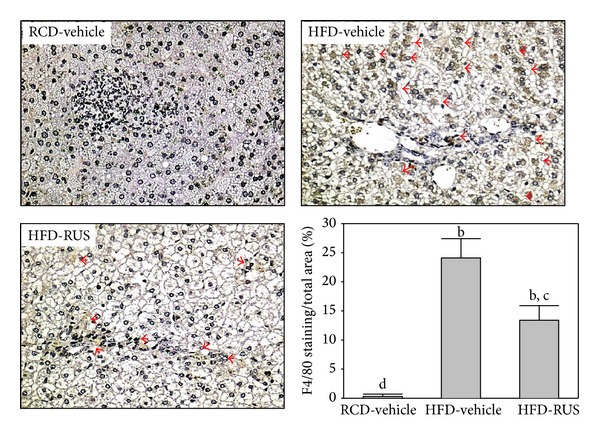
Representative images of F4/80 staining in livers from RCD- or HFD-fed hamsters receiving 8 weeks of treatments. Photomicrographs are of tissues isolated from vehicle-treated RCD-fed hamsters (RCD-vehicle), vehicle-treated HFD-fed hamsters (HFD-vehicle), or ruscogenin (3.0 mg/kg/day) treated HFD-fed hamsters (HFD-ruscogenin). Arrows indicate inflammatory foci. Quantification of hepatic macrophage accumulation is presented as the percentage of the brown stained area relative to the whole area of the photomicrograph (original magnification, 400x). Values (mean ± SEM) were obtained from 5 animals in each group. b P < 0.01 compared to vehicle-treated RCD-fed hamsters. c P < 0.05 and d P < 0.01 compared to the values of vehicle-treated HFD-fed hamsters in each group, respectively.
