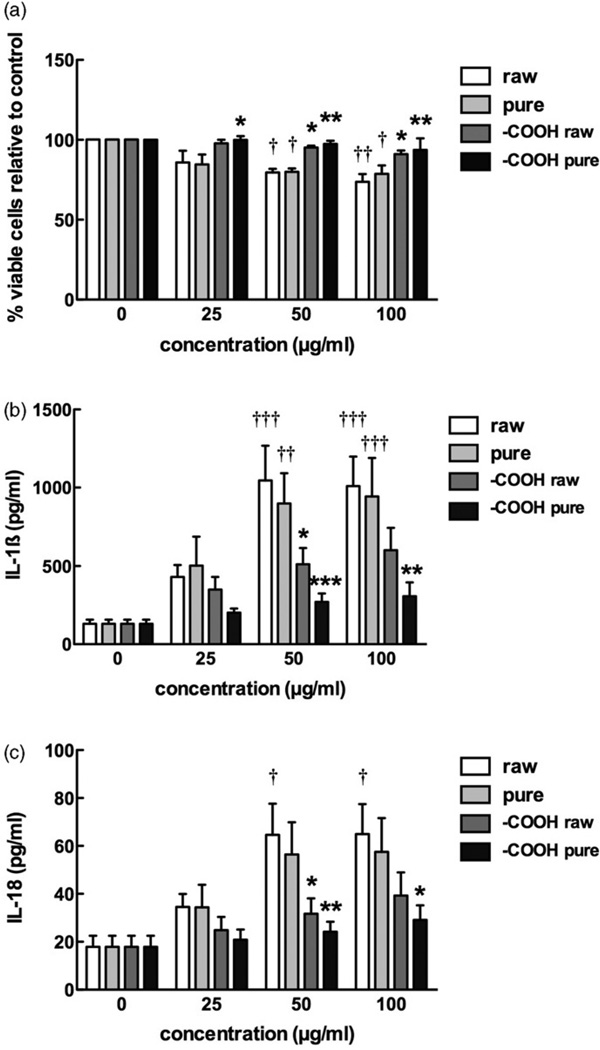
Figure 10.
Supportive experimental data obtained in the transformed human THP-1 cell line exposed to MWCNT for 24 h. The results are completely consistent with those found in the mouse AM cell shown in Figure 7; (a) cell viability by MTS assay expressed as mean±SEM percent relative to unstimulated control cultures, (b) IL-1β production expressed as mean±SEM, (c) IL-18 production expressed as mean±SEM. Asterisks indicate *p<0.05, **p<0.01, or ***p<0.001 by Bonferroni’s correction following two-way ANOVA compared to “raw” at each corresponding concentration. Daggers (†) indicate comparison to the 0 µg/ml or baseline condition, with the number indicating the significance level similar to the asterisks. Sample n=3.

