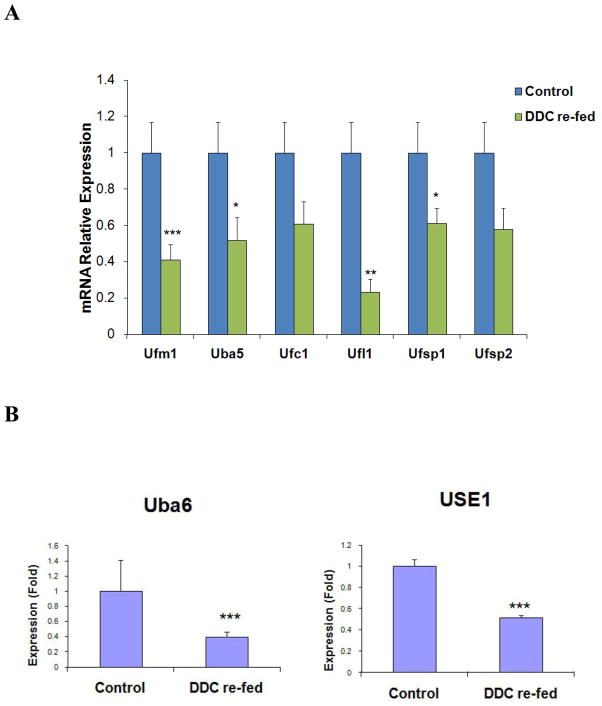
Figure 1.
Decrease of mice Ufmylation and FATylation components in the livers of DDC re-fed mice. Gene expression levels of different Ufmylation (A) and FATylation (B) components are shown. Data represent mean values ±S.E.M. Statistical significance was determined using the t-test with SigmaStat software. * p<0.05, **p<0.01, and ***p<0.001 by t-test.

