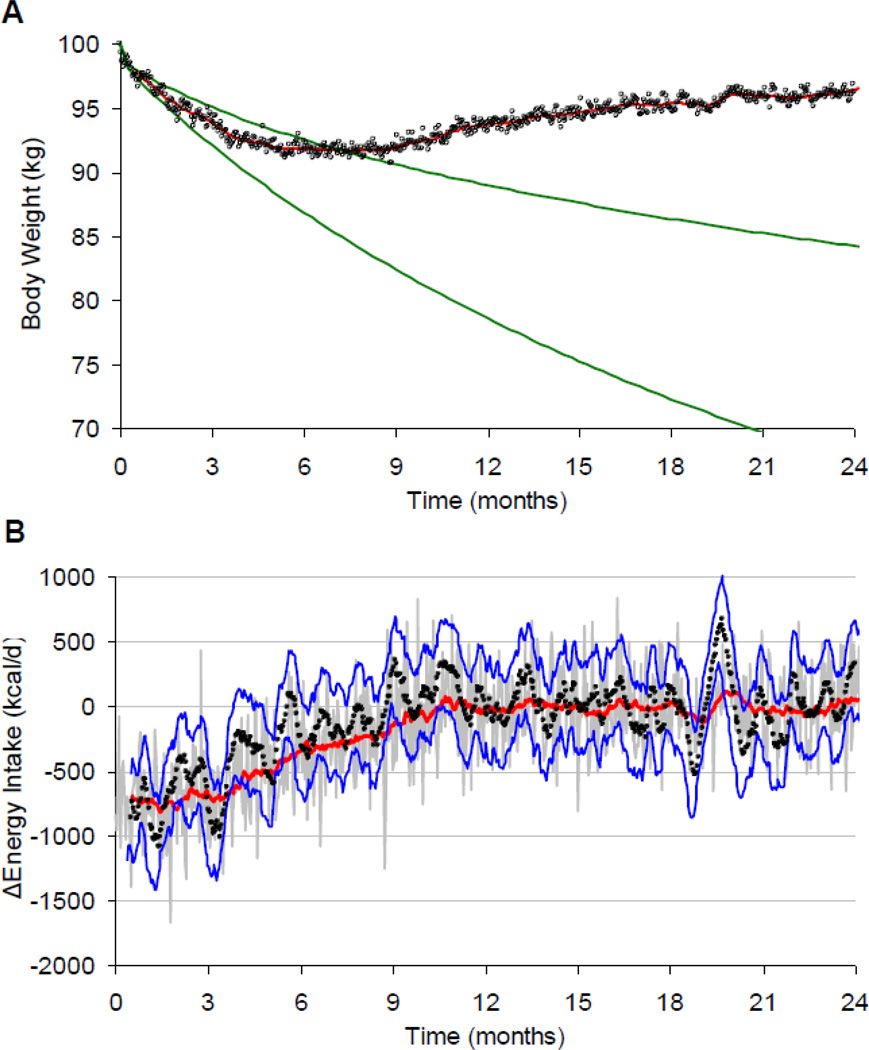
Figure 2.
Simulated weight loss plateau and regain as a result of loss of diet adherence. (A) A prescribed 750 kcal/d reduction in baseline energy intake was predicted to result in a body weight trajectory falling within the green curves. However, weight loss typically plateaus after 6–8 months and is often followed by slow regain. (B) The gray curve shows the simulated daily energy intake changes underlying the body weight trajectory. The red curve is the 28 day moving average and the filled black circles and blue curves are the estimated average energy intake and its 95% confidence interval calculated using only the body weight data.

