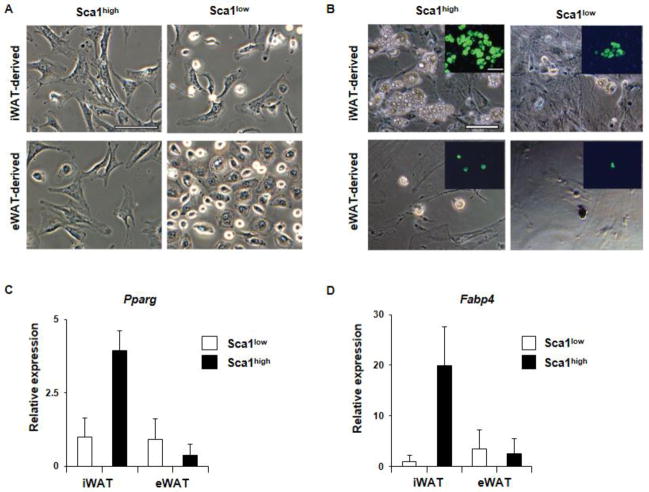
Figure 2.
Adipogenic potential of Sca1high and Sca1low ASCs isolated from iWAT and eWAT. (A) The morphology of iWAT- and eWAT-derived Sca1high ASCs and Sca1low cells shown under phase microscopy. Scale = 100 μm. (B) Adipocyte differentiation (7 days after adding adipogenic mix) shown under phase microscopy. The insets show the lipid droplets (green) detected in adipocytes. Scale = 100 μm. (C) Pparg mRNA expression in iWAT- and eWAT-derived ASCs before and after adipogenesis. N=4. (D) Fabp4 expression before and after adipogenesis. N=4. Shown as means ± SEM.

