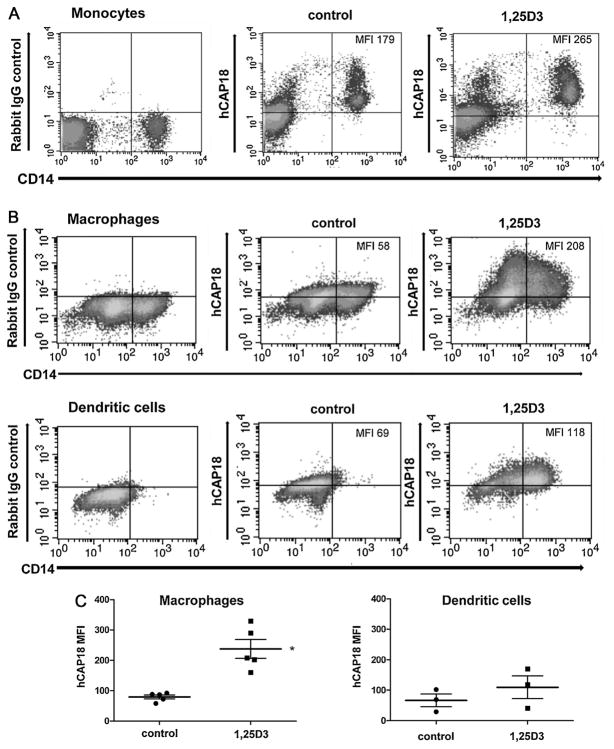
Fig. 2. Induction of hCAP18 expression by 1,25D3 treatment in monocytes, macrophages and dendritic cells.
(A) Monocytes were cultured for 24 h in control media or media with 10 nM 1,25D3 and then stained for both CD14and hCAP18 or control rabbit IgG. The MFI for hCAP18 is noted in the upper right corner of the FACS density plots. (B) Macrophages and dendritic cells were treated with vehicle or with 10 nM 1,25D3 for 48 h and then stained for both CD14 and hCAP18 expression and shown as density plots. The total MFI for hCAP18 is noted in the upper right corner of the density plots. The plots are representative of 3 donors tested. (C) Comparison of hCAP18 MFI between macrophages and dendritic cells by scatter plot from 5 experiments with macrophages and 3 with dendritic cells treated as in part B. In each group, the central line represents the mean, while the error bars depict the standard error, and the asterisk denotes that induction was statistically significant in macrophages as compared to control and to the dendritic cell 1,25D3 treatment group (p < .05).

