
Figure 3. Subcellular distribution of GFP-AR, GFP-ARΔ(294–556) and GFP-ARΔ(1–293) in C4-2 cells.
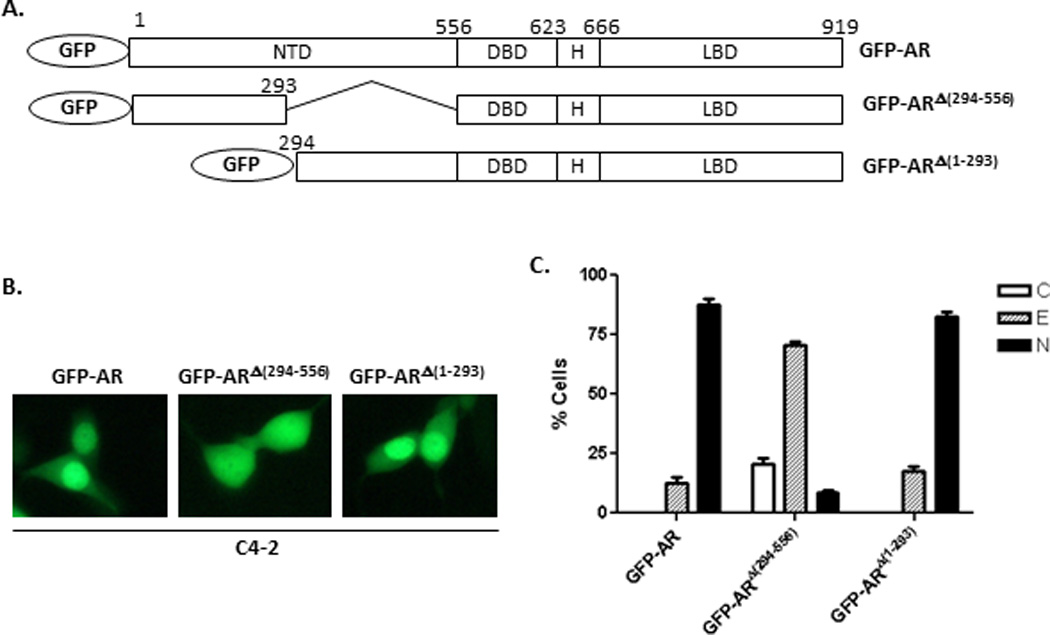
(A) Diagram of different GFP-AR deletion constructs, GFP-AR, GFP-ARΔ(294–556), and GFP-ARΔ(1–293). (B) Representative fluorescent images of C4-2 cells transiently transfected with GFP-AR, GFP-ARΔ(294–556) or GFP-ARΔ(1–293) in in androgen-free conditions 16 hours after transfection. The results were derived from five transfections for each GFP-fusion protein construct. (C) Quantitative analysis of results in (B). At least 200 cells were counted for each transfection to determine the percentage of the cells displaying cytoplasmic (C), even (E), or nuclear (N) localization. The experiment was reproduced 5 times.